
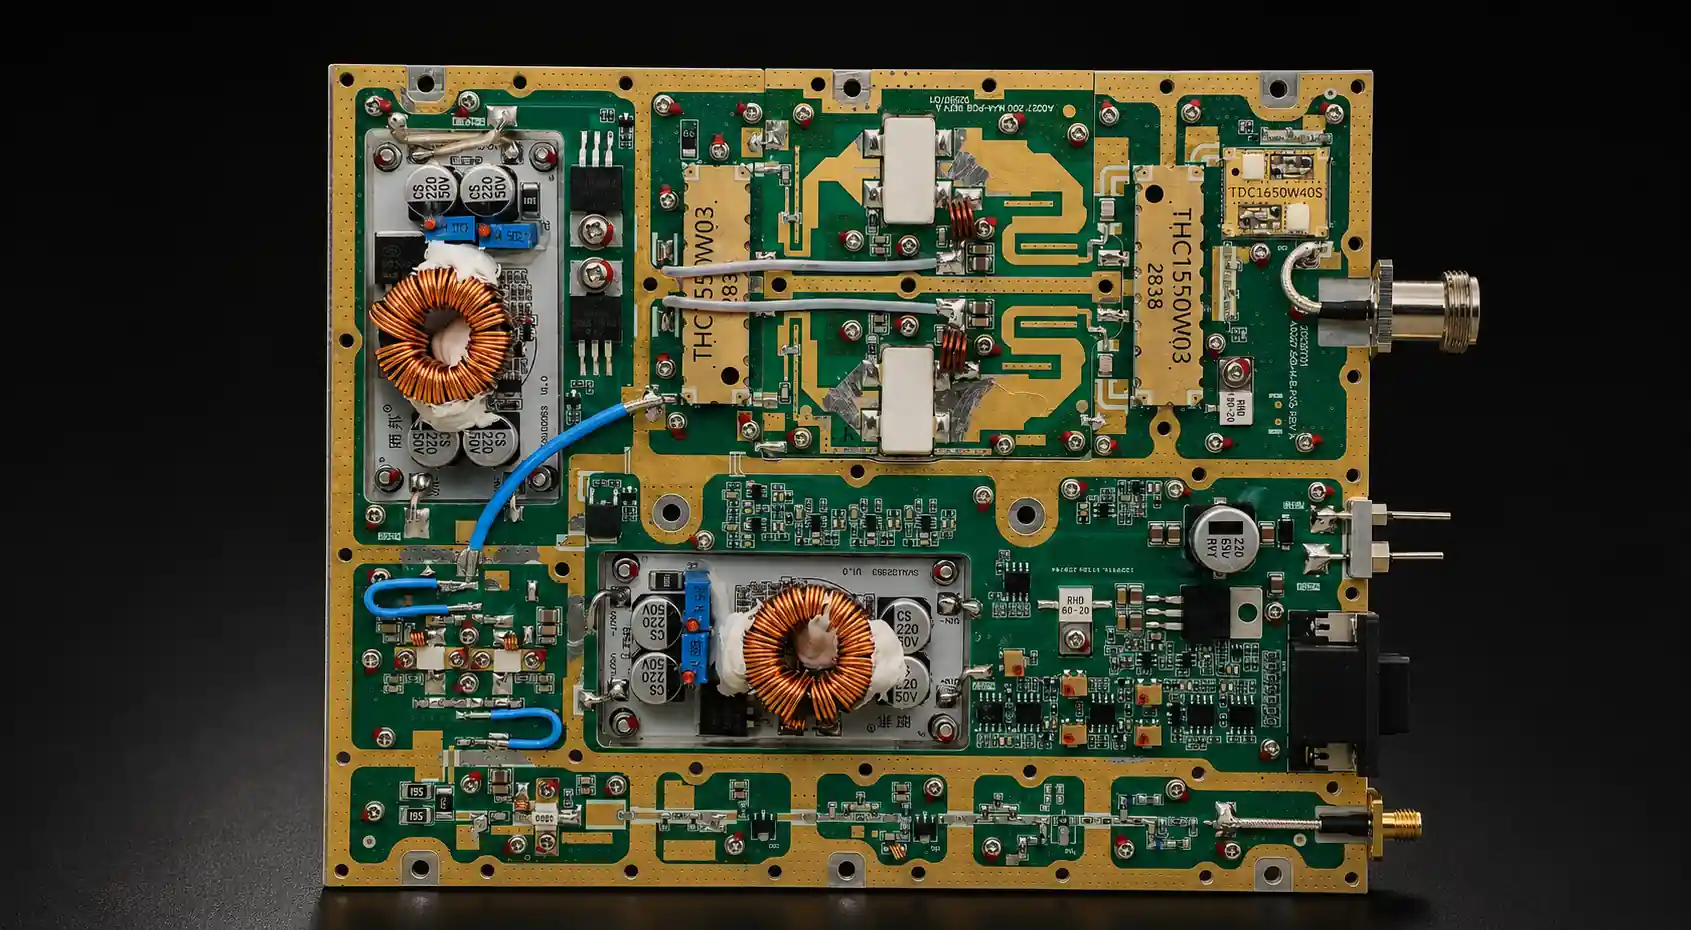
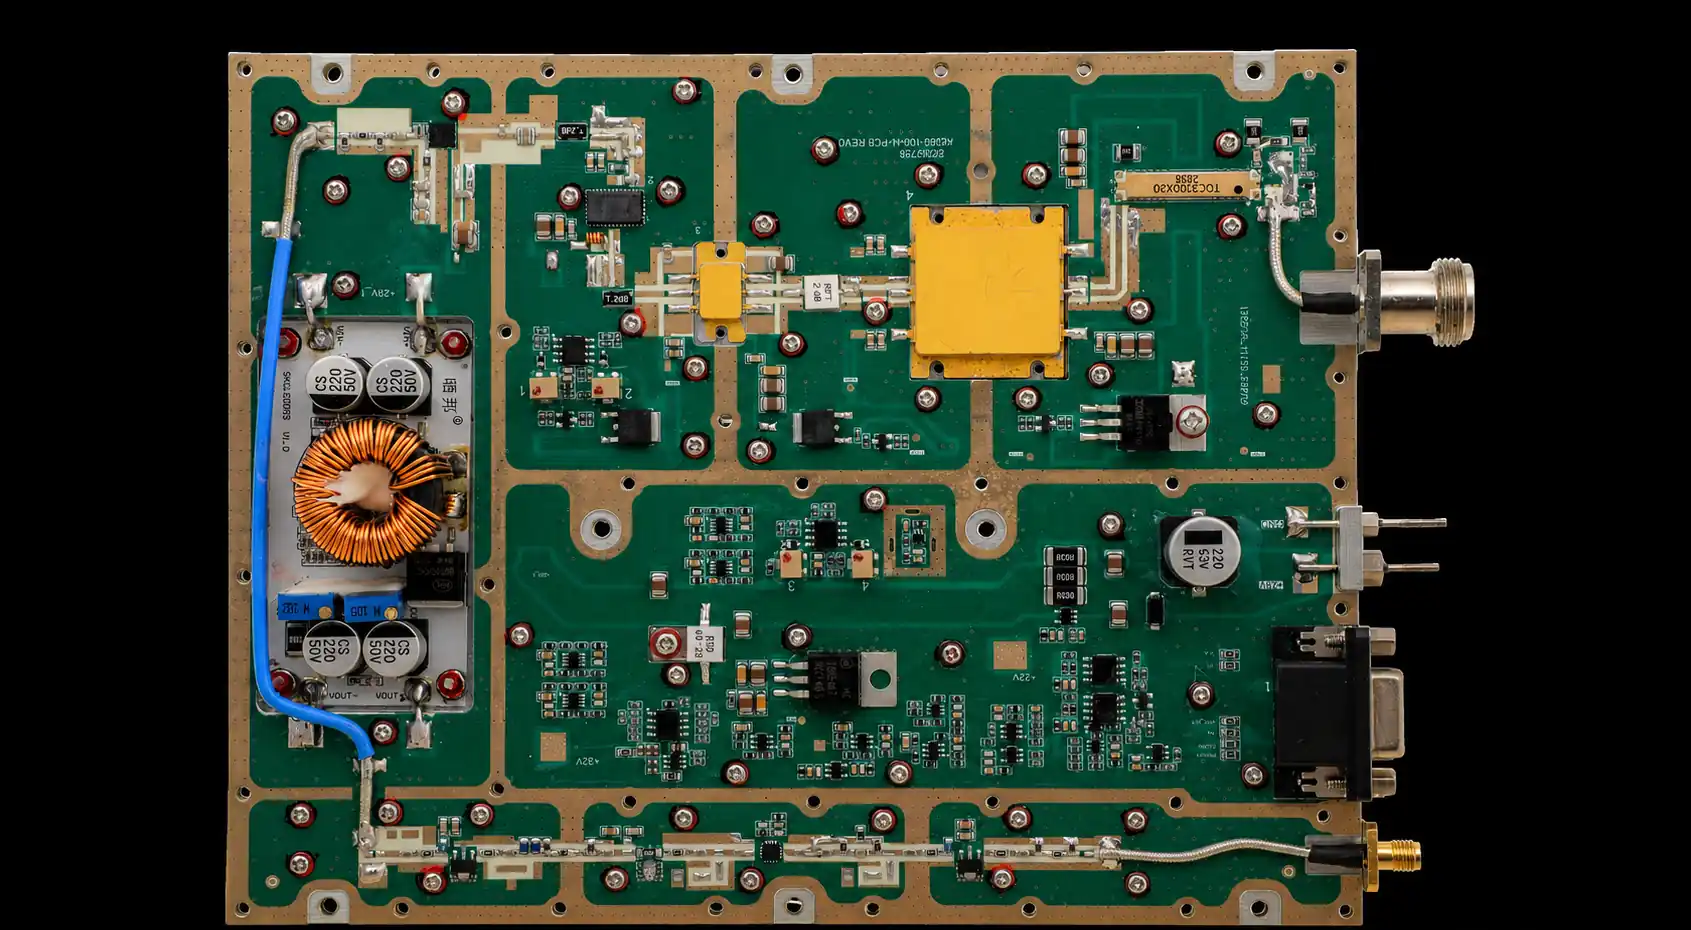


A buyer reviewing an RF PA test report for a 2–6 GHz 100 W module may receive a gain curve, an input VSWR result, an output-power table, and a harmonic screenshot. Every result may show PASS. The approval question is whether those records can be connected to the same module without relying on assumptions.
That is the purpose of an RF PA test evidence chain.
Small-signal gain, input VSWR, full-power output, and harmonic measurements do not use one identical setup. They answer different questions under different test-specific conditions. They become one approval record only when four evidence layers remain clear:
Unit and test identity → Test boundary → Measurement and correction → Approval decision
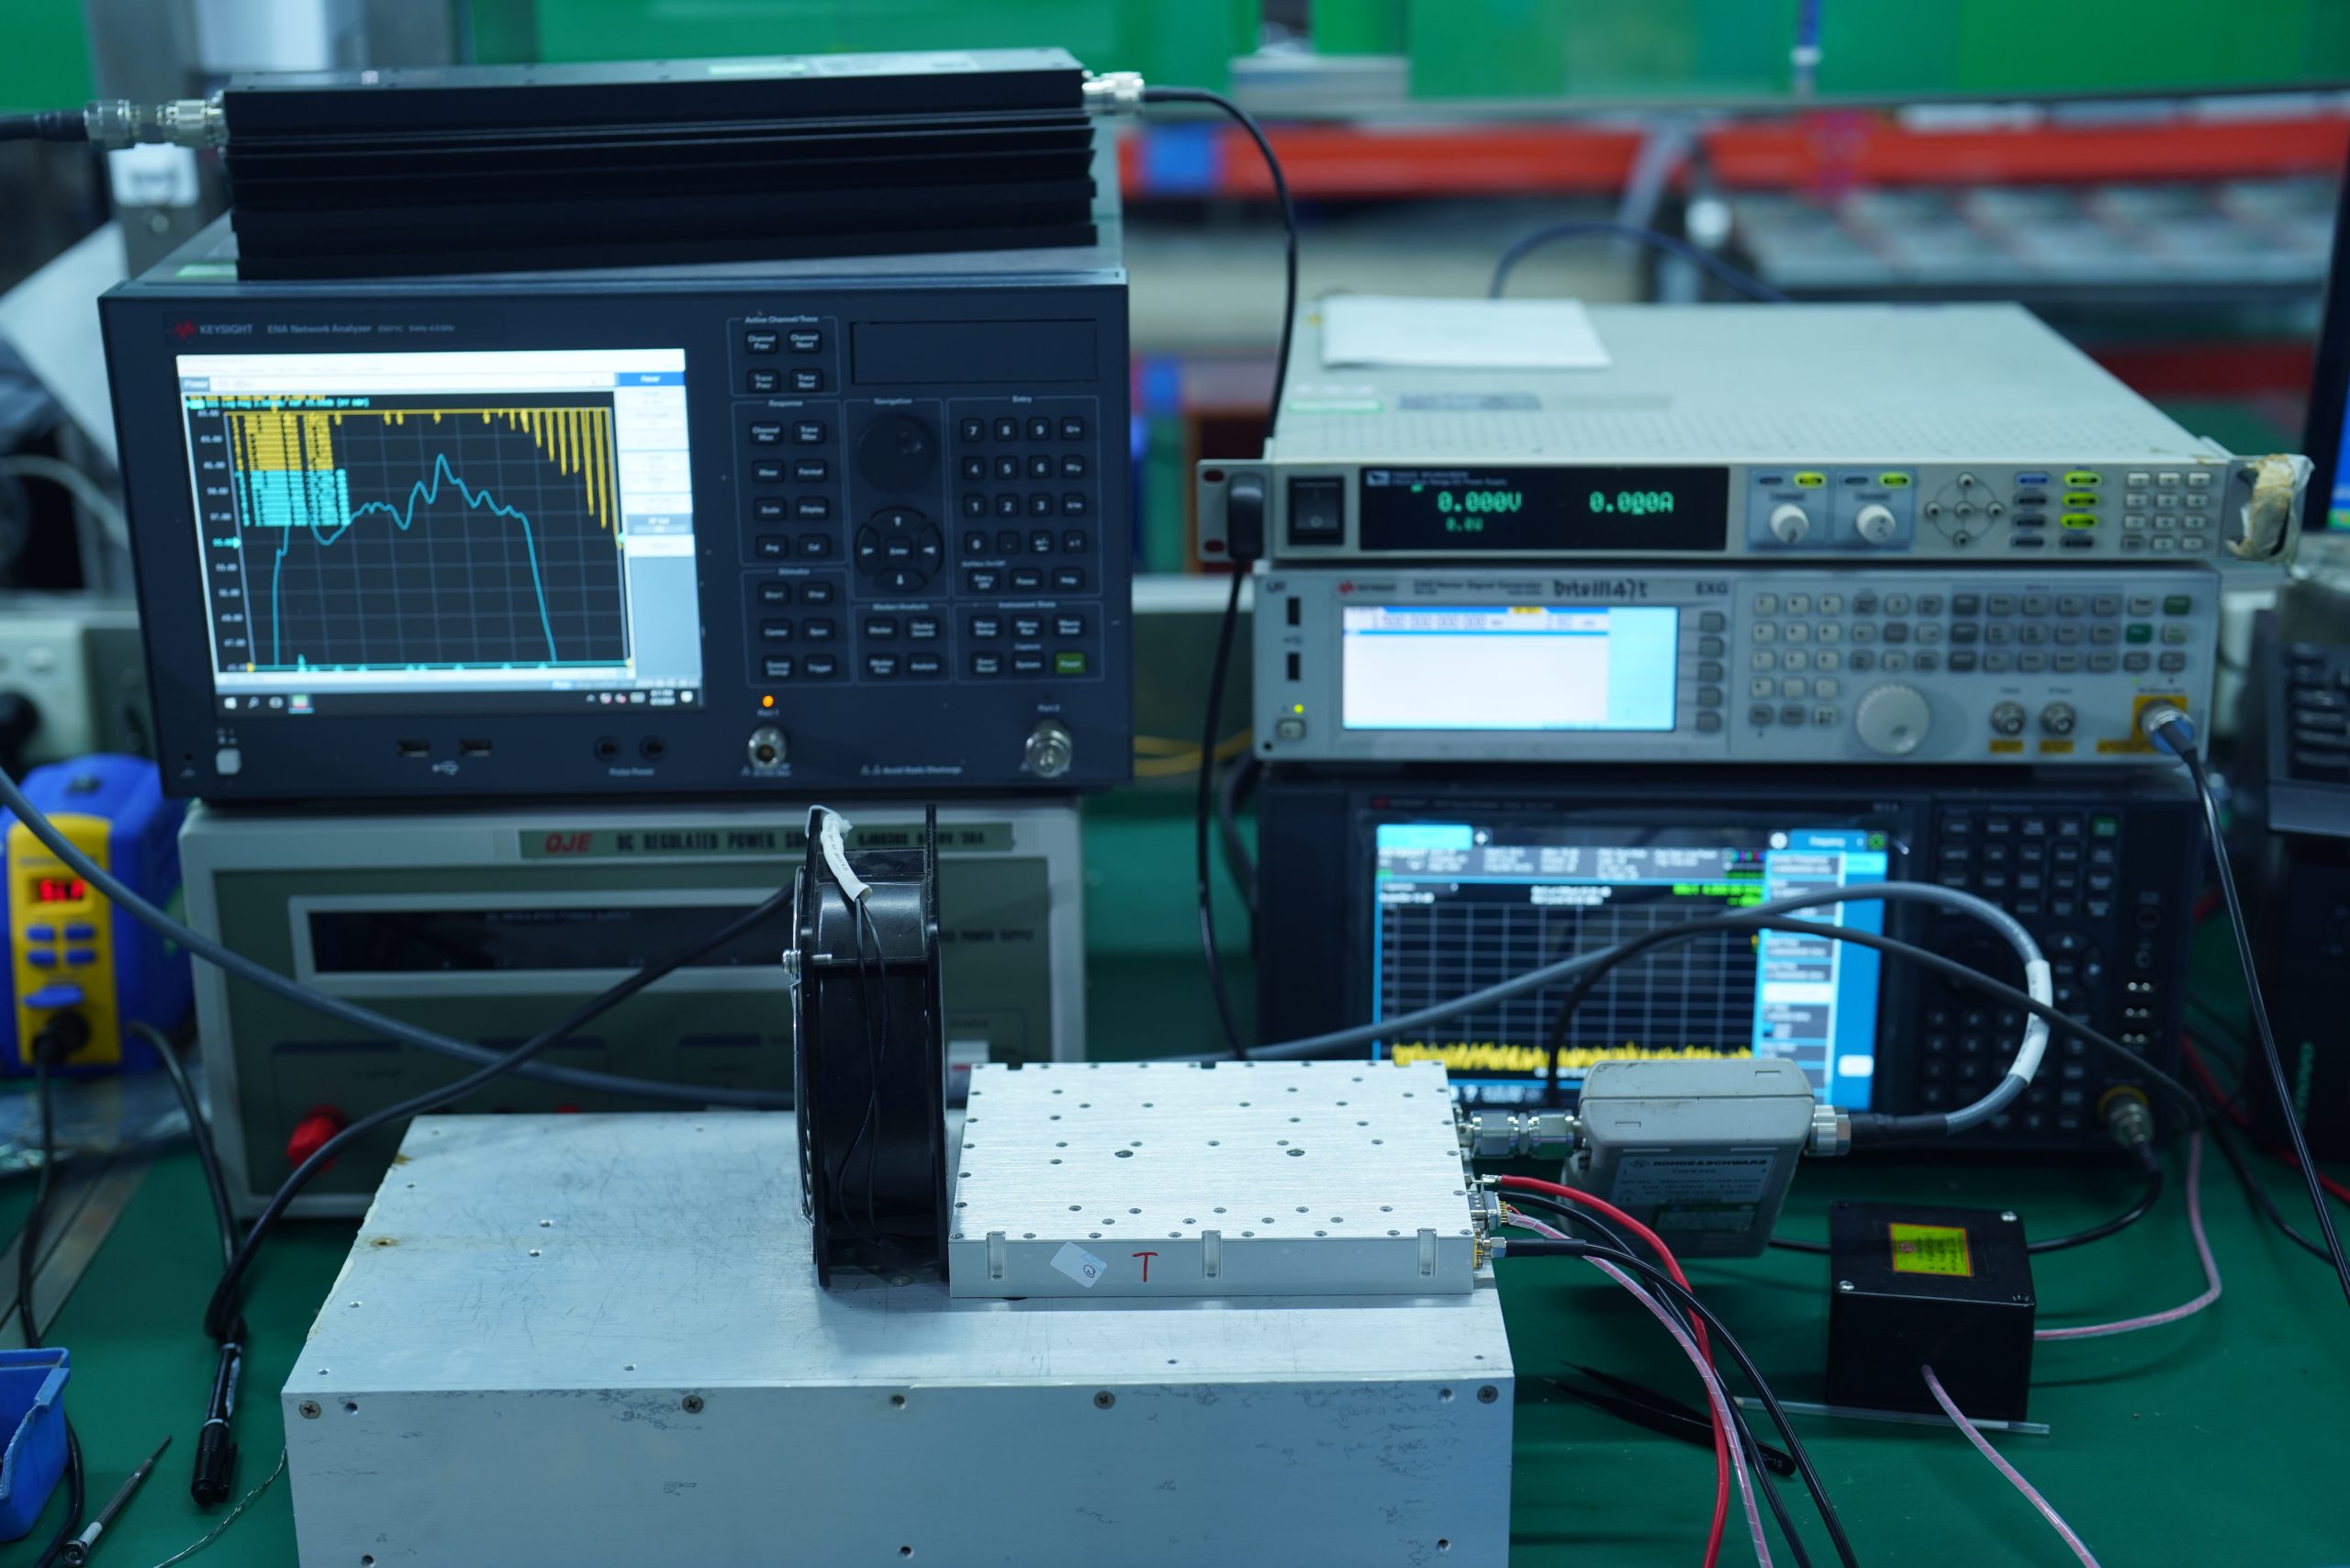
The sequence below shows how gain, input VSWR, output power, and second-harmonic checks are performed during the factory test process for a 2–6 GHz 100 W RF PA.
For batch production, the resulting test data is recorded automatically and organized into an individual S/N-linked report for each delivered module.
A practical evidence chain should therefore contain:
Model + Module S/N + Controlled Configuration Revision
→ Run ID + Fundamental Frequency Key + Test Point ID
→ VNA / Power / Spectrum Test Boundaries
→ Instrument Results + Signed Corrections + Corrected Results
→ Limit-Set Version + Margin + PASS / REVIEW / FAIL
1. Why Separate PASS Results Can Still Leave an Approval Gap
A PASS label proves only that one measured result met the limit applied to that record. It does not prove that the surrounding results belong to the same production unit, hardware configuration, or test run.
A gain sweep may come from a qualification sample. The power table may come from a later production unit. The harmonic screenshot may show a convenient center frequency rather than the customer’s required band edge. Every result can be technically genuine while the combined package remains unsuitable for shipment approval.
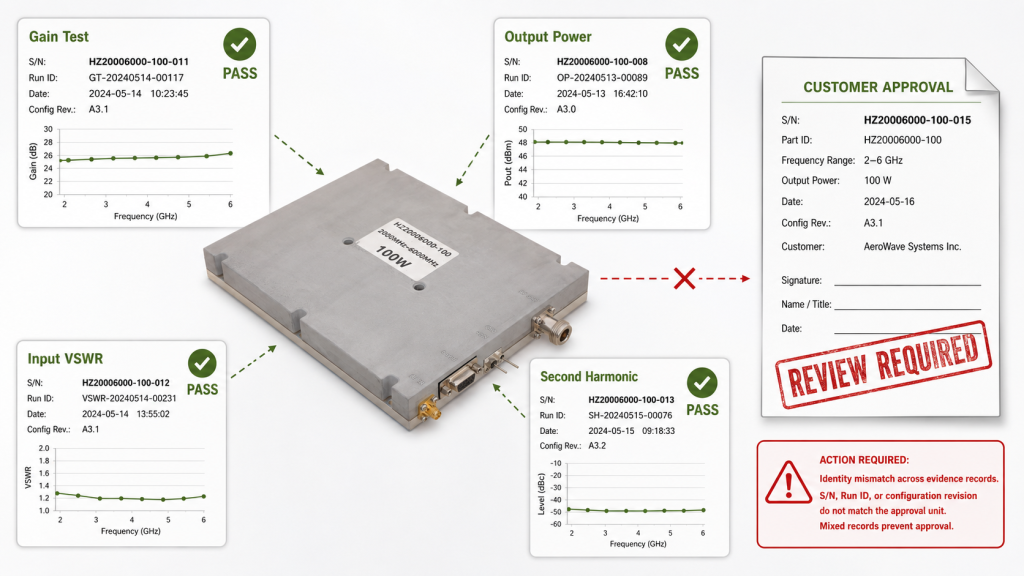
The first review should therefore distinguish four evidence layers.
Unit and Test Identity
These fields connect the records:
- module model;
- individual module S/N;
- controlled hardware or configuration revision;
- report version;
- common run ID;
- test point ID;
- fundamental frequency key.
Test Boundary
These fields explain how each result was obtained:
- VNA setup and calibration reference plane;
- source-path condition;
- PA-input reference plane;
- PA-output reference plane;
- spectrum sample-path configuration;
- DC, load, cooling, and thermal state;
- instrument-specific calibration and correction IDs.
Measurement and Correction
These fields show how the final value was produced:
- instrument result before external path correction;
- signed correction value;
- correction-file version;
- corrected engineering result;
- unit of measurement.
Approval Decision
These fields explain why the result passed:
- acceptance-limit version;
- margin to limit;
- applicable guard band;
- PASS / REVIEW / FAIL status;
- retest disposition.
The phrase “same test condition” should not be used as a blanket requirement. A VNA gain sweep and a full-power spectrum test cannot share the same drive level, signal path, instrument configuration, or thermal state.
What they should share is the same unit identity, controlled configuration, intentionally aligned frequency plan, and traceable relationship between their separate test boundaries.
A useful S/N-linked RF PA test report should also distinguish production evidence from:
- design-verification data;
- reference-sample data;
- engineering-development data;
- data from another hardware revision.
Separate PASS results become shipment evidence only when their identity, boundaries, calculations, and approval rules can be connected without assumption.
2. How Small-Signal Results Should Connect to Full-Power Testing
Small-signal and full-power tests should be connected, but they should not be treated as interchangeable.
A small-signal gain sweep establishes the low-drive frequency-response baseline. It may reveal gain variation, an abnormal dip, band-edge reduction, or a point that deserves closer full-power review.
Small-signal input VSWR establishes the source-facing match under the recorded VNA condition. It does not automatically describe every behavior that may appear under full-power operation.
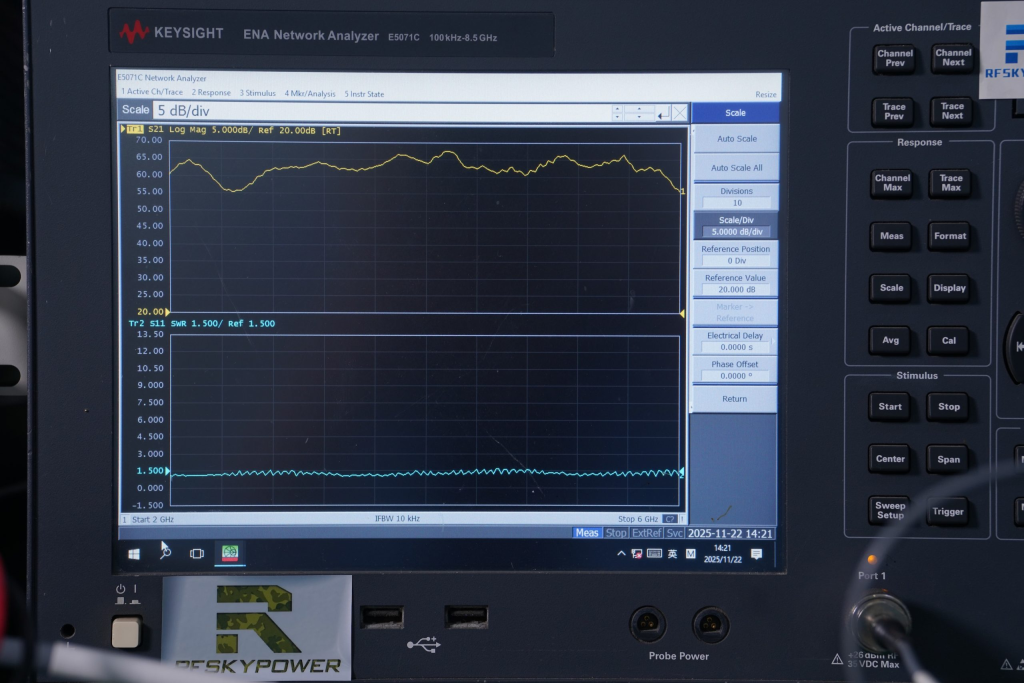
A reviewable VNA record should identify:
- VNA source power;
- sweep range and point count;
- IF bandwidth;
- module bias and enable state;
- calibration reference plane;
- fixture and adapter configuration;
- external attenuation or receiver-protection arrangement;
- any report-level fixture correction;
- VNA setup ID.
Full-power testing answers a different question: what happens when the PA is driven to the required output condition?
That record should identify:
- actual Pin at the PA input;
- corrected Pout at the PA output connector;
- Vdc and Idc;
- load condition;
- cooling condition;
- cold or thermally stabilized state;
- dwell time;
- protection status;
- full-power test ID.
A clean small-signal curve does not prove that the same gain relationship remains valid near compression or after heat builds. The distinction between small-signal and full-power RF PA gain must remain visible.
The two tests may also use different frequency density. A VNA sweep may contain hundreds of points, while a full-power RF PA test may focus on:
- band edges;
- customer priority frequencies;
- abnormal points found during the VNA sweep;
- frequencies with the lowest gain margin;
- points defined by the acceptance plan.
The records do not need identical tables. They need common connection fields:
Module S/N + Configuration Revision + Fundamental Frequency Key + Test Point ID
Reference-Plane Alignment
Matching frequency alone is not enough.
If small-signal gain is compared with large-signal gain, both results should refer to the same physical PA input and output boundaries. Where that is not possible, the report should provide a documented mapping between the VNA reference planes and the full-power reference planes.
For example, a VNA S21 result measured through fixtures and adapters should not be compared directly with:
Corrected Pout − Actual Pin
unless the fixture effects have been removed or clearly included in the comparison.
For a 2–6 GHz RF Power Amplifier Module, this alignment allows the customer to see which small-signal observations were intentionally carried into the full-power test plan.
Small-signal and full-power results answer different questions, but their records should remain joinable through common identity, frequency, test-point, and reference-plane information.
3. Why Pin, Pout, and Large-Signal Gain Must Share the Same Frequency Row
A gain curve, a separate Pout column, and one “typical input power” value do not show how the PA reached its output target at each frequency.
Every full-power test point should contain:
Fundamental Frequency → Actual Pin → Corrected Pout → Large-Signal Gain → Vdc → Idc → Test State
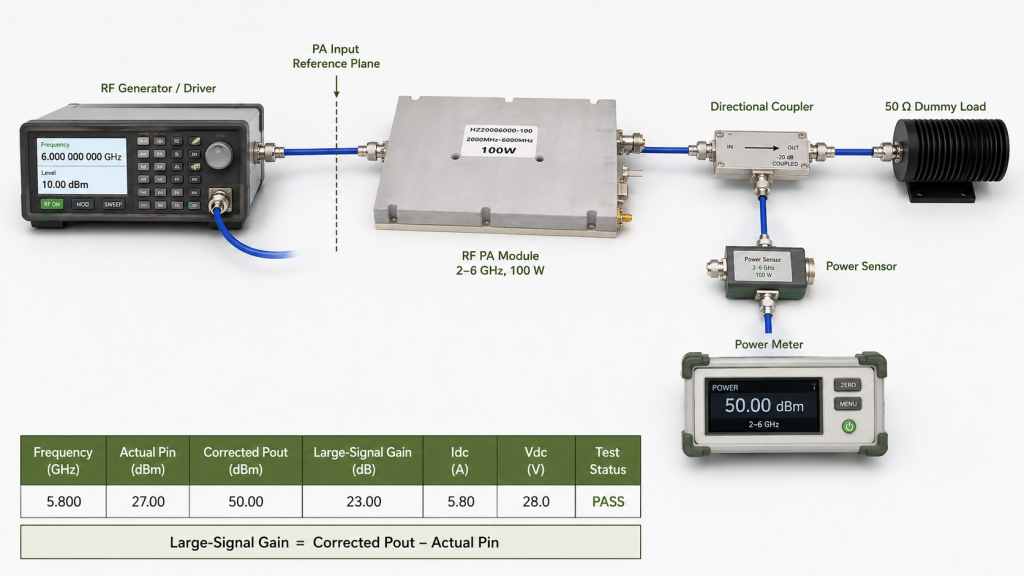
Large-signal gain is calculated from actual PA input power and corrected PA output power under the tested output condition:
Large-Signal Gain = Corrected Pout − Actual Pin
Actual Pin is not automatically the signal-generator setting.
If the source path contains passive cables, adapters, and switches, a frequency-specific signed path correction may be sufficient:
Source Setting + Signed Source-Path Correction = Actual Pin
The correction record should state its direction. A negative cable loss and a positive compensation value should not be mixed without a clear sign convention.
Active Driver Stages Need Different Treatment
An active driver should not be treated as a fixed passive correction.
Driver gain may change with:
- frequency;
- input level;
- output compression;
- temperature;
- supply condition.
If the source path contains an active driver, actual Pin should preferably be measured at the PA input. An alternative is a driver characterization performed at the same frequency, drive level, supply, and thermal condition.
The output record should preserve the same calculation structure:
Instrument Result at the Sample Path + Signed Output-Path Correction = Corrected Pout at the PA Output
The report should retain:
- source setting;
- source-path condition;
- actual Pin;
- instrument power result;
- output-path correction;
- corrected Pout;
- correction IDs.
This shared frequency row exposes information that separate PASS screenshots can hide.
Two frequencies may both reach 50 dBm. One may require substantially higher Pin. Without the common row, both results appear equally strong. With it, the customer can identify:
- the point with the lowest large-signal gain;
- the point requiring the highest drive;
- whether output was recovered by increasing Pin;
- whether the customer’s SDR or driver can reproduce the condition;
- whether the PA is approaching the permitted input boundary.
Comparing Small-Signal and Large-Signal Gain
Once the physical reference planes are aligned, the two gain records can support an additional engineering check:
Gain Reduction at the Test Point = Small-Signal Gain − Large-Signal Gain
This difference may show where the PA needs more drive or is operating closer to compression. It should not be treated as a complete compression measurement by itself.
The comparison is meaningful only when both values refer to:
- the same fundamental frequency;
- the same physical PA boundaries;
- the same controlled module configuration;
- clearly defined test-specific conditions.
Pin, Pout, and large-signal gain should share one full-power frequency row, while the small-signal record remains connected through common keys and aligned reference planes.
4. Why Power and Harmonic Results Need a Validated Output Boundary
The power meter and spectrum analyzer often observe the PA through different paths.
The main RF line may run from the PA through a directional coupler to a controlled 50 Ω load. A power sensor may use one coupled branch. The spectrum analyzer may use another branch containing an attenuator, splitter, adapter, and cable.
Their instrument results should not be expected to match directly.
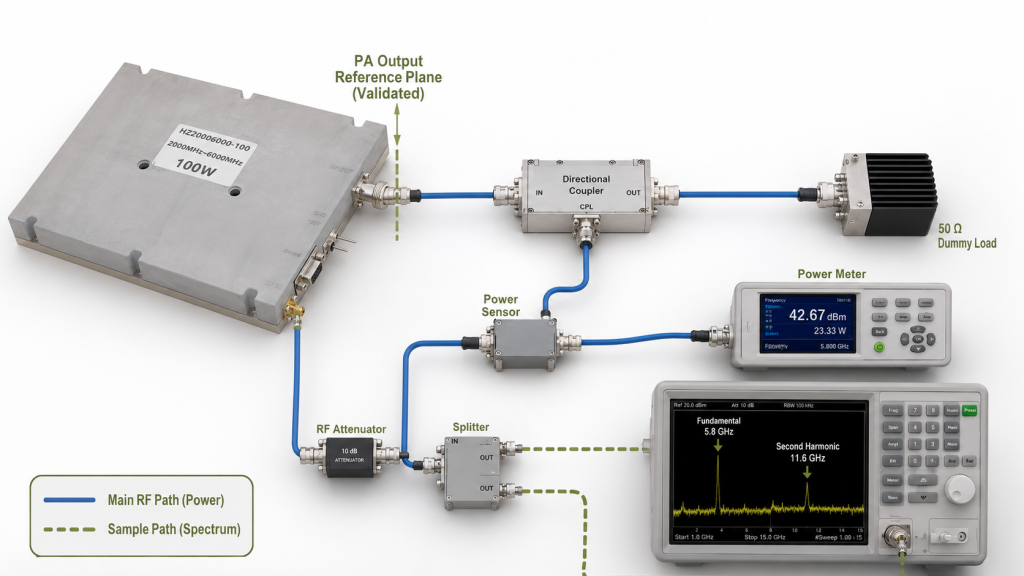
A reviewable power record should preserve:
Power-Sensor Result + Signed Output-Path Correction = Corrected Pout at the PA-Output Reference Plane
A reviewable spectrum record should preserve:
Analyzer Marker Result + Frequency-Specific Spectrum-Path Correction = Corrected Spectral Level
The RF PA test-path loss compensation record should identify:
- cable loss;
- coupler factor;
- attenuation;
- splitter loss where applicable;
- adapter contribution;
- correction direction;
- measured RF frequency;
- correction-file version.
Fundamental Frequency Is Not the Same as Measured Harmonic Frequency
A spectrum record needs more than one generic “frequency” field.
For each spectral component, it should identify:
| Field | Example |
|---|---|
| Fundamental Frequency Key | 5.8 GHz |
| Spectral Component | Second Harmonic |
| Measured RF Frequency | 11.6 GHz |
| Spectrum-Path Correction ID | Correction valid at 11.6 GHz |
This distinction matters because the correction is applied at the measured component frequency, not automatically at the fundamental frequency.
The Fundamental Reference for Harmonic dBc
Harmonic dBc should normally be calculated from fundamental and harmonic results that share a validated measurement relationship.
Where practical:
Corrected Second-Harmonic dBc = Corrected Analyzer Second-Harmonic Level − Corrected Analyzer Fundamental Level
Using the analyzer fundamental and harmonic through the same validated spectrum path reduces ambiguity.
A power-meter Pout value should not be substituted blindly for the analyzer fundamental. It may be used only when the report demonstrates that:
- both values represent the same RF operating state;
- the waveform and detector behavior are compatible;
- both paths are corrected to the same PA-output reference plane;
- analyzer overload has been excluded;
- timing and averaging conditions are aligned;
- the relationship between the two measurement paths has been validated.
The spectrum record should also preserve:
- RBW;
- VBW;
- detector;
- span;
- input attenuation;
- reference level;
- preamplifier status;
- averaging settings where used.
Changes in RBW and harmonic-test settings can alter the displayed result even when the PA has not changed.
The Harmonic Path Must Cover the Measured Frequency
For a 2–6 GHz PA:
- the second harmonic extends from 4 to 12 GHz;
- the third harmonic extends from 6 to 18 GHz.
The analyzer, coupler, attenuator, splitter, cable, adapters, and correction file must cover the harmonic frequency being reported—not only the 2–6 GHz fundamental band.
A sample path characterized only to 8 GHz cannot prove the 12 GHz second harmonic produced by a 6 GHz fundamental. It also cannot prove an 18 GHz third-harmonic result.
PASS Margin Also Matters
A result that passes by 0.2 dB does not carry the same approval margin as a result that passes by 8 dB.
Where contractual guard bands or measurement uncertainty apply, the release rule should state:
- measured margin to limit;
- applicable uncertainty or guard band;
- whether the guard band is included in the PASS rule;
- how borderline results are classified.
Power and harmonic results become comparable only when their frequencies, paths, corrections, operating states, and approval margins form a validated relationship.
5. What the Automated Test Record Should Preserve
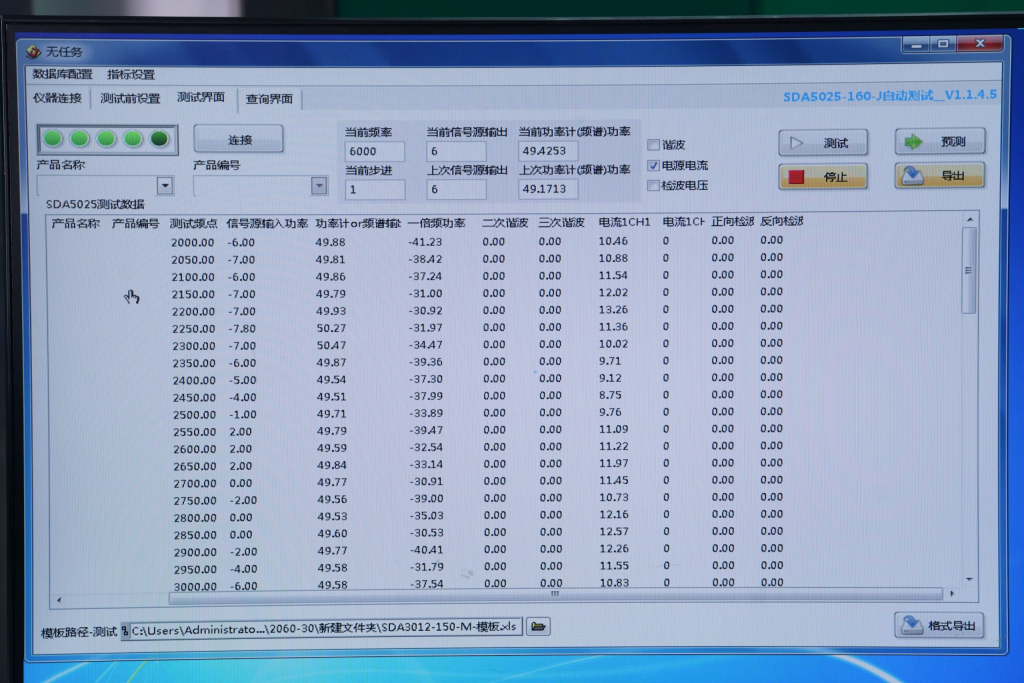
Automation is valuable when it preserves relationships. It is not valuable merely because it produces results faster.
The VNA, power, and spectrum data may remain in separate tables. Forcing every instrument result into one oversized worksheet can make the evidence harder to control.
The records should instead follow one structured evidence model.
What Actually Connects Separate RF PA Test Records
| Evidence layer | Required fields | Why it matters |
|---|---|---|
| Unit identity | Model, individual S/N, controlled configuration revision | Prevents mixed-unit or mixed-version evidence |
| Test-run identity | Common run ID, station ID, test point ID | Identifies the execution and links separate records |
| Frequency identity | Fundamental frequency key, spectral component, measured RF frequency | Aligns power and spectrum data correctly |
| Test boundary | Setup ID, calibration ID, reference plane, test state | Explains how each result was obtained |
| Measurement result | Instrument result, signed correction, corrected result | Makes the calculation reviewable |
| Approval decision | Limit-set version, margin, status, disposition | Connects the result to shipment release |
A timestamp is useful, but it should not be the only connection key. Instrument clocks may not be synchronized, and an exported-file timestamp may differ from the actual measurement time.
A common run ID and test point ID provide a more reliable relationship across:
- VNA records;
- power records;
- spectrum records;
- automated test records;
- report exports.
The term “instrument result” is also more accurate than “raw reading” in every case. A VNA S21 result may already include the instrument’s internal calibration. The report should distinguish between:
- the calibrated instrument result;
- any external fixture or path correction;
- the final report value.
Retest History Must Remain Controlled
If a frequency is repeated after a cable reconnection, drive adjustment, thermal stabilization, or protection event, the system should preserve:
- original result;
- reason for retest;
- changed condition;
- replacement or additional result;
- final disposition.
Replacing the first result with a better result may produce a cleaner report, but it weakens traceability.
Automation adds value when it preserves the relationship between identity, test boundary, instrument result, correction, corrected result, approval limit, and retest disposition.
6. What Each S/N-Linked RF PA Test Report Must Prove
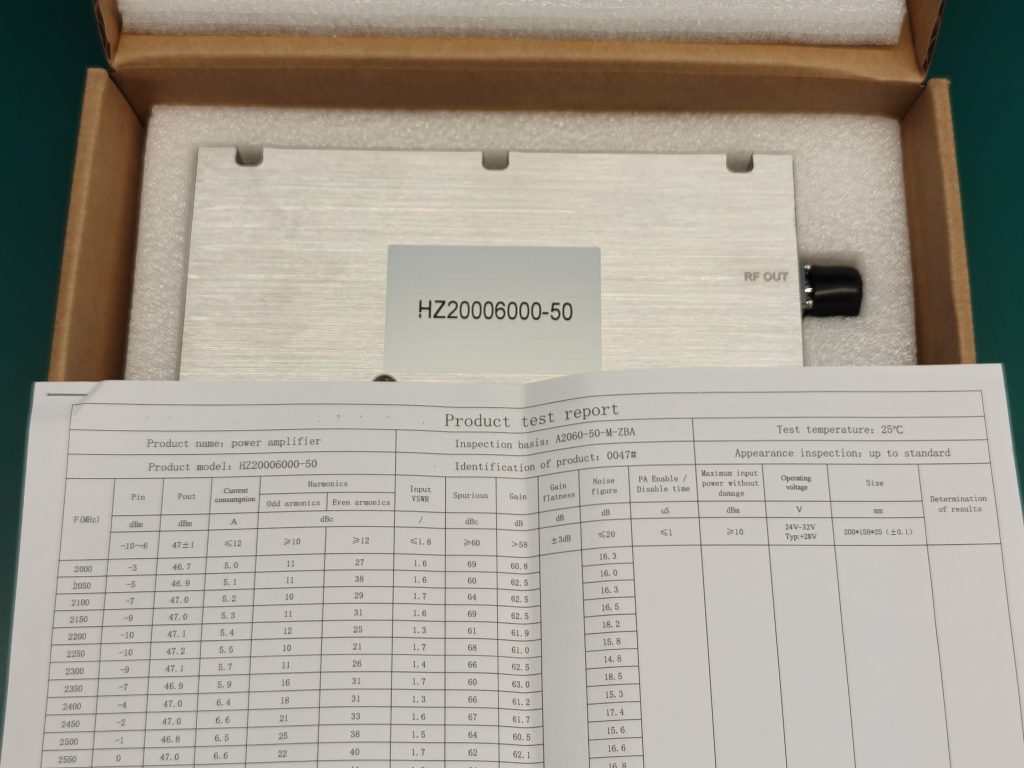
For batch production, shipment traceability should come from automated test data and an individual report for every delivered RF PA.
Each report should be linked to one module S/N. It should allow the customer to confirm which unit was tested, which frequency points were used, under what boundaries the results were obtained, and whether the module met the defined acceptance limits.
The report should not combine representative data from different samples. A typical gain curve, a power result from another unit, or a harmonic screenshot without a matching S/N cannot replace the production record for the delivered module.
Unit Identity
Each report should identify:
- module model;
- individual S/N;
- controlled configuration revision;
- report number and version;
- test date;
- final release status.
This prevents results from different units or hardware revisions from being combined into one approval package.
Connected Test Results
The report should connect the required test records through the same module identity and defined frequency points.
Depending on the acceptance plan, the unit-level report should include:
- small-signal gain;
- input VSWR;
- actual Pin;
- corrected Pout;
- large-signal gain;
- Vdc and Idc;
- applicable harmonic results;
- load and cooling condition;
- cold or thermally stabilized state;
- acceptance limits;
- margin to limit;
- PASS / REVIEW / FAIL conclusion.
Not every test needs to appear in one oversized table. Small-signal, full-power, and spectrum results may remain in separate sections, provided they share enough identifiers to be connected without assumption.
Corrected Results Must Remain Reviewable
A final PASS value should not appear without a defined measurement boundary.
Where path correction affects the result, the report should identify:
- the instrument result before external correction;
- the signed correction value;
- the correction reference;
- the corrected result;
- the physical reference plane.
This allows the customer to understand how actual Pin, corrected Pout, and harmonic levels were obtained.
Automated Records Reduce Batch-Production Errors
Automated recording is especially valuable in batch production because it reduces manual transcription, file-matching, and screenshot-selection errors.
The test system should associate each result with:
- the module S/N;
- the tested frequency;
- the applicable test ID;
- the measured value;
- the correction method;
- the acceptance limit;
- the final result status.
If a point is retested, the system should preserve the retest status and final disposition rather than silently replacing the earlier record.
One Unit, One Report
The customer does not need a collection of disconnected screenshots. The customer needs one controlled report that answers:
Which module was tested, what conditions were used, what results were recorded, and why was that unit released?
For batch shipments, every delivered RF PA should have its own S/N-linked production test report. This provides scalable unit-level traceability without relying on representative sample data.
Automated test data supports efficient batch production; one S/N-linked report proves the acceptance results for each delivered RF PA.
RFQ Checklist for an S/N-Linked RF PA Test Report
| RFQ item | What to provide or request | What it confirms |
|---|---|---|
| Unit-level production report | One automated S/N-linked test report for every delivered RF PA | Each module has its own traceable acceptance evidence |
| Unit identity | Module model, individual S/N, controlled configuration revision, report number, and report version | The results belong to the delivered unit and correct hardware configuration |
| Test date and release status | Test date, report generation date, and final PASS / REVIEW / FAIL conclusion | The report is current and the unit has a defined release decision |
| Frequency plan | Tested frequency range, required frequency points, band edges, and project-priority frequencies | The report covers the frequencies the customer will actually use |
| Small-signal gain | Gain results with the tested frequency points and defined reference planes | The unit’s frequency-response baseline is recorded |
| Input VSWR | Input VSWR results with the VNA test boundary and acceptance limit | The input-match result belongs to the same module and defined test condition |
| Full-power input record | Source setting, passive source-path correction or measured PA-input power, and actual Pin | The drive condition used to reach the output result is traceable |
| Full-power output record | Instrument result, signed output-path correction, corrected Pout, and PA-output reference plane | The reported output power can be reviewed and reproduced |
| Large-signal gain | Actual Pin and corrected Pout recorded on the same frequency row | The customer can see how much drive was required at each test point |
| DC operating condition | Vdc and Idc at each required full-power frequency point | Output results can be checked against the electrical operating condition |
| Load and cooling condition | Load type, cooling method, airflow or heatsink boundary, and installation condition | The test result is not separated from its thermal and RF load boundary |
| Thermal state | Cold-state or thermally stabilized condition, dwell time, and applicable case temperature | Results from different thermal states are not mixed |
| Spectrum result | Fundamental frequency, spectral component, measured RF frequency, instrument result, correction, corrected level, and dBc result | Harmonic results are connected to the correct fundamental and measurement frequency |
| Harmonic-path coverage | Valid frequency range of the coupler, attenuator, splitter, cable, adapters, analyzer, and correction file | The measurement path supports the harmonic frequency being reported |
| Analyzer settings | RBW, VBW, detector, span, input attenuation, reference level, and averaging where used | Spectrum results were obtained under a defined instrument boundary |
| Correction traceability | Signed source, output, and spectrum-path corrections with applicable correction references | Corrected results can be traced back to the instrument values |
| Reference-plane mapping | Defined PA-input and PA-output planes, plus any mapping between VNA and full-power setups | Small-signal and full-power results refer to comparable physical boundaries |
| Acceptance limits | Gain, input VSWR, Pin, Pout, DC, harmonic, and other project-defined limits | PASS refers to a defined customer or project requirement |
| Margin to limit | Measured margin and guard-band rule where required | A borderline PASS can be distinguished from a result with stable margin |
| Retest control | Retest status, reason for any repeated or replaced result, and final disposition | Abnormal results were not silently removed from the approval process |
| Automated data linkage | Module S/N, run ID, test point ID, frequency, measured value, correction, limit, and result status | Separate test records can be connected without relying on filenames or screenshots |
| Supporting traceability | Calibration, correction, station, software, and detailed retest records retained by the supplier | Deeper audit or failure review remains possible where required |
| Final shipment conclusion | Approved frequencies, exceptions, report status, and release signature or controlled approval field | The delivered module has a clear and reviewable acceptance conclusion |
Conclusion
Four RF PA tests can all pass while still failing to prove one shipment unit.
Approval should not depend on the number of screenshots. It should verify that the records share a controlled unit identity, reliable run and test-point keys, aligned physical reference planes, reviewable corrections, defined test states, and clear approval margins.
For a 2–6 GHz 100 W RF PA, the customer-facing shipment report should contain enough connected evidence to approve the delivered unit. The supplier should retain the deeper calibration, correction, software, and retest records needed for audit or failure review.
RF SKYPOWER can support early engineering review of the frequency plan, input-drive boundary, reference planes, output target, harmonic limits, cooling condition, correction method, and S/N-linked evidence format before final module approval.