



RF PA power back-off sounds simple: reduce a 200 W module to 100 W and expect the electrical and thermal burden to fall with the RF output. That assumption can influence PA sizing, power-supply margin, and cooling decisions before the lower-power operating point has actually been measured.
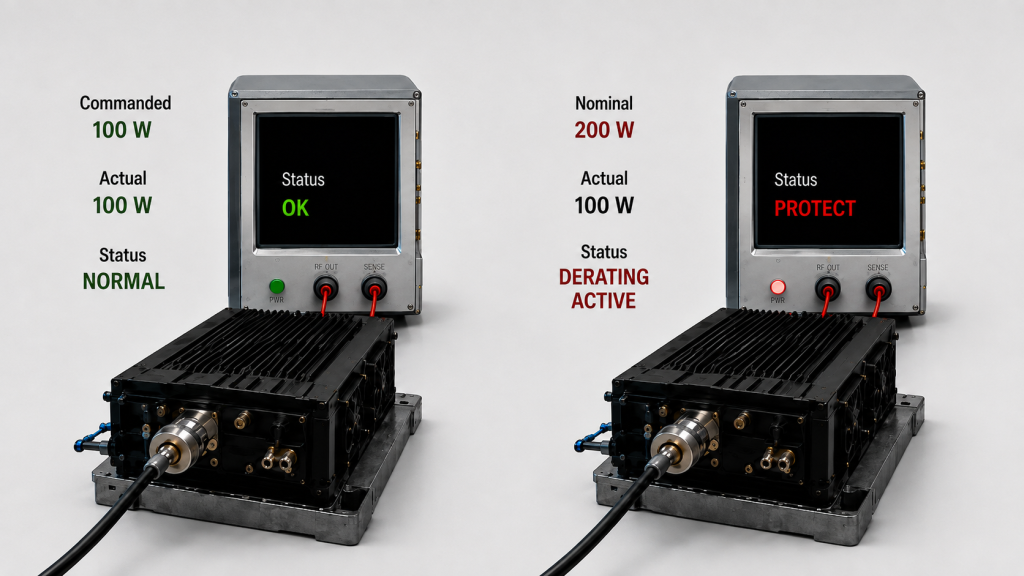
The complication is that the same lower Pout can come from a deliberate power command or from unwanted derating. Those two conditions may look similar on an output-power display, but they should not be treated as the same operating state.
If your system will spend much of its duty cycle below rated power, what should be verified before you assume the backed-off operating point is actually easier on the PA and the system?
1. What Counts as RF PA Power Back-Off?
In this article, commanded power back-off means operating the PA at a deliberately selected output level below a defined reference point. It is treated separately from unintended output reduction caused by thermal, DC-supply, load, or protection limits.
Back-off should also be quantified against a stated reference.
For output back-off:
OBO (dB) = Pout,reference (dBm) − Pout,operating (dBm)
The same relationship can be expressed with linear RF power:
OBO (dB) = 10 log10(Pout,reference / Pout,operating)
The reference may be:
- rated output;
- P1dB;
- Psat;
- or another agreed test point.
The important requirement is that the reference is stated explicitly and used consistently.
For example, if 200 W is the agreed output reference, operating at 100 W represents approximately 3 dB of output back-off.
Input back-off and output back-off are related but should not be treated as numerically interchangeable.
Reducing RF input drive relative to a defined input reference is input back-off (IBO). The resulting change in RF output is output back-off (OBO). The two values can differ because gain and compression behavior between the input and output reference points are not necessarily linear.
A lower Pout also does not automatically prove that the PA is intentionally operating in back-off.
A nominally 200 W PA may produce 100 W because the system deliberately commanded a lower operating point.
But it may also produce 100 W because:
- the DC supply is sagging;
- temperature has triggered derating;
- the load condition has changed;
- a protection function is limiting output;
- the available RF input drive is insufficient;
- or another operating limit has been reached.
The measured Pout may be similar, but the engineering meaning is different.
Commanded back-off should therefore be separated from unwanted derating before efficiency is evaluated.
Intentional Back-Off vs Unwanted Derating
| Condition | Commanded Back-Off | Unwanted Derating |
|---|---|---|
| Why Pout is lower | Defined control or drive target | Another limit is reducing output |
| Reference condition | Known back-off relative to an agreed RF reference | May not represent an intended back-off point |
| Expected behavior | Repeatable lower operating point | Requires root-cause review |
| What to record | Command, IBO/OBO where applicable, Pin, Pout, Vdc, Idc | Temperature, voltage, load, alarms, Pin, Pout |
| Can it support an efficiency comparison? | Yes, if the test boundaries match | Not until the derating cause is separated |
Before calculating efficiency, confirm that the lower output point is intentional, referenced, and stable.
Otherwise, the result may describe a fault, protection event, thermal limit, or supply limitation rather than normal back-off behavior.
2. Why Can RF PA Efficiency Change as Output Is Reduced?
Rated-output efficiency should not be scaled down automatically when the amplifier operates below its rated or reference output point.
If a PA is specified at one full-power operating point, that percentage describes that point under its stated measurement conditions. It does not automatically define what happens at 1 dB, 3 dB, 6 dB, or another level of output back-off.
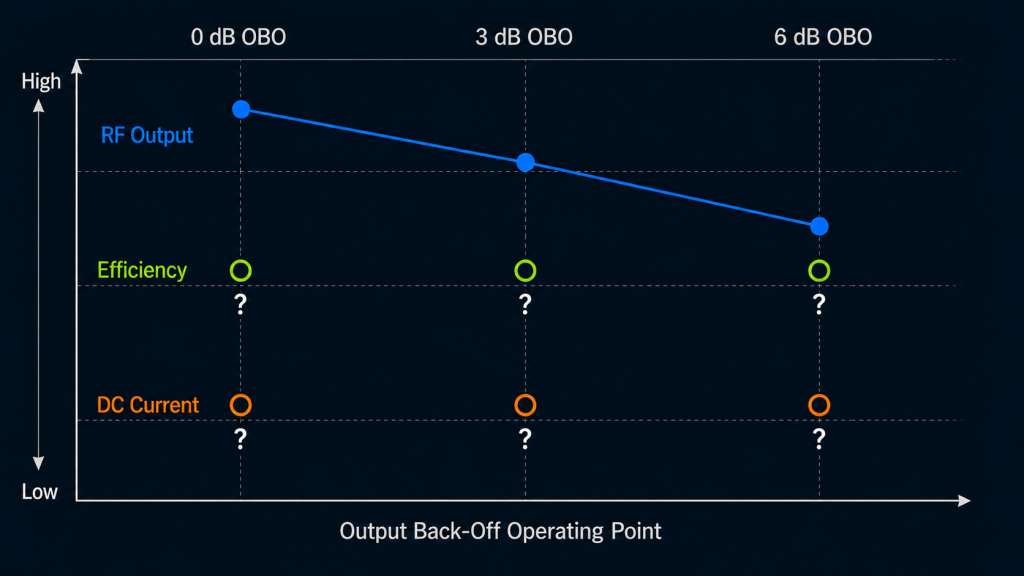
As Pout is reduced, several parts of the operating condition may change:
- RF input drive;
- transistor operating point;
- gain and compression state;
- DC current;
- contribution of fixed internal electrical loads;
- matching behavior;
- control state;
- and thermal condition.
The exact relationship depends on the PA architecture and operating method.
Efficiency may decrease as output is backed off, but it should not be assumed to do so in every design or at every back-off point.
The useful engineering question is therefore not:
“How much efficiency will I lose?”
It is:
“What efficiency, current, and operating state does this PA actually show at the OBO points my system will use?”
This distinction also prevents a common selection error.
Two modules may show similar rated-output efficiency but behave differently at 3 dB or 6 dB output back-off.
Conversely, a module with a less attractive headline efficiency percentage may still have acceptable electrical behavior at the actual project operating point.
If supplier datasheet percentages are being compared before any back-off testing is available, first verify whether the published RF PA datasheet efficiency values use comparable metrics and measurement conditions.
Frequency should also remain controlled during a back-off comparison. If the project operates across a wide range, efficiency variation across RF PA frequency bands should be evaluated separately rather than mixed into the power-level comparison.
The objective is to isolate output back-off as the variable being studied.
3. How Should RF PA Back-Off Efficiency Be Measured?
A useful back-off efficiency curve requires more than several Pout values.
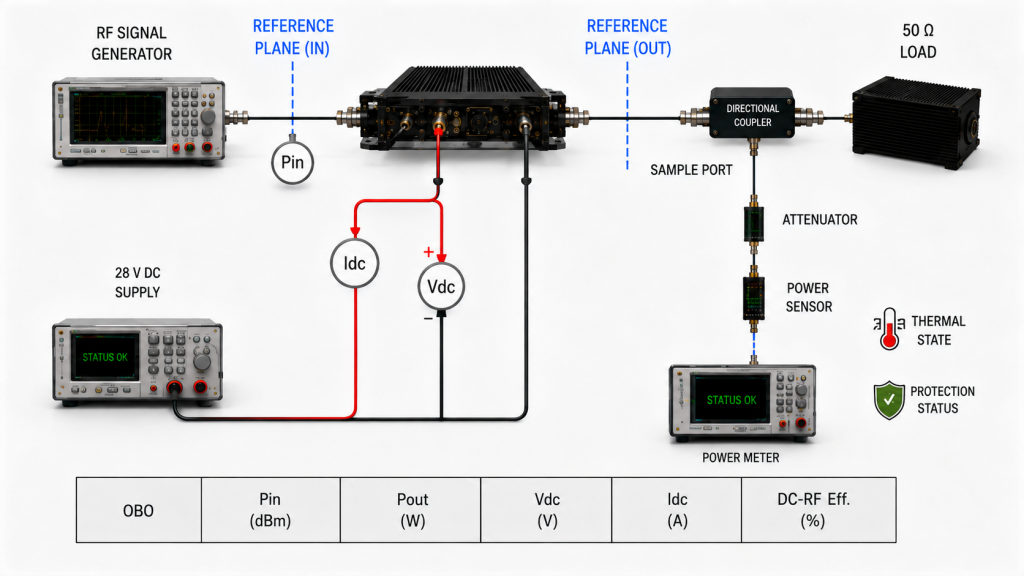
Each operating point should define:
- the OBO reference;
- actual RF input and output power;
- the efficiency metric;
- the electrical boundary;
- waveform and power convention;
- load condition;
- and thermal state.
Use the same efficiency definition at every point
For complete module DC-to-RF efficiency:
Module DC-to-RF Efficiency (%) = Pout / Pdc,module × 100%
For a defined single module DC input:
Pdc,module = Vdc × Idc
If multiple DC rails or auxiliary electrical loads are included in the module boundary, the denominator should include the agreed electrical loads consistently at every measurement point.
For power-added efficiency:
PAE (%) = (Pout − Pin) / Pdc,DUT × 100%
For drain efficiency:
Drain Efficiency (%) = Pout / Pdc,drain × 100%
The drain-efficiency denominator should represent the DC drain power supplied to the RF power stage or stages included in the stated measurement boundary. It should not be used as another name for complete module DC-to-RF efficiency.
The detailed difference between PAE and drain efficiency should be resolved before curves based on different efficiency metrics are compared.
The key rule is:
Use the same efficiency definition and measurement boundary at every point on the back-off curve.
Define the back-off reference
Do not report only:
100 W operating point
when the decision depends on back-off behavior.
Also identify what that 100 W is backed off from.
For example:
Reference Pout = 200 W
Operating Pout = 100 W
OBO ≈ 3 dB
A 3 dB OBO value referenced to rated output should not automatically be treated as equivalent to 3 dB OBO referenced to P1dB or Psat.
The reference belongs in the test definition.
Keep the RF reference planes defined
Record actual Pin and Pout at agreed RF reference planes.
Do not assume that a signal-generator setting is the same as RF power reaching the PA input. Cable loss, attenuators, drivers, switches, and other RF path elements may change actual Pin.
Similarly, the required Pout reference plane must remain clear.
A PA-port output value should not be mixed with an antenna-end requirement unless the RF path loss between those reference planes is explicitly accounted for.
Record Vdc and Idc at every output point
Do not estimate backed-off current by scaling rated current according to the RF output percentage.
Measure it.
For each point, record:
- Vdc at the defined electrical boundary;
- Idc;
- actual Pin;
- actual Pout;
- OBO;
- efficiency;
- and the relevant operating state.
If DC supply behavior itself becomes a concern, review RF PA efficiency and DC power-supply stress separately rather than turning a back-off test into a complete power-distribution analysis.
Control waveform, duty cycle, and power convention
Back-off data should state whether the signal is:
- CW;
- pulsed;
- or modulated.
For pulsed or modulated operation, Pin, Pout, and DC power should use a consistent averaging or gating interval so that the numerator and denominator represent the same observation window.
The back-off reference must also use the same RF power convention as the operating point.
For example, an average operating Pout should not be compared with a peak-power reference and reported as though the resulting value were a directly comparable OBO measurement.
Where peak, average, burst, or gated values are relevant, state the convention explicitly.
Keep thermal state consistent
A cold measurement at one OBO point should not be compared directly with a stabilized hot-state result at another point.
If the intended application is continuous or long-duty operation, define the thermal criterion used for every point.
Where thermal stabilization itself is the main question, use a dedicated continuous-CW efficiency test instead of making the back-off test carry the complete hot-state procedure.
Define the load condition
The test should also record:
- load condition;
- agreed VSWR where applicable;
- cooling condition;
- ambient condition;
- protection status;
- and whether any unintended derating is active.
If these change between OBO points, the resulting curve may no longer represent output back-off alone.
Back-Off Efficiency Evidence Curve
| Output Target / OBO | Actual Pout | Pin | Vdc | Idc | Efficiency | Thermal State | Protection Status |
|---|---|---|---|---|---|---|---|
| Reference / 0 dB | Measured | Measured | Measured | Measured | Calculated | Defined | Normal / recorded |
| Intermediate OBO | Measured | Measured | Measured | Measured | Calculated | Same criterion | Normal / recorded |
| Normal operating OBO | Measured | Measured | Measured | Measured | Calculated | Same criterion | Normal / recorded |
| Low-output OBO | Measured | Measured | Measured | Measured | Calculated | Same criterion | Normal / recorded |
The exact number of output points depends on the project.
The important requirement is that the curve covers the OBO levels the system will actually use and that all points share a consistent reference and measurement boundary.
4. Can Oversizing a PA Create a Back-Off Penalty?
Choosing a PA with more rated output can provide useful power margin.
But oversizing does not automatically make the system electrically or thermally easier to operate.
The answer depends on where the module will spend most of its operating time.
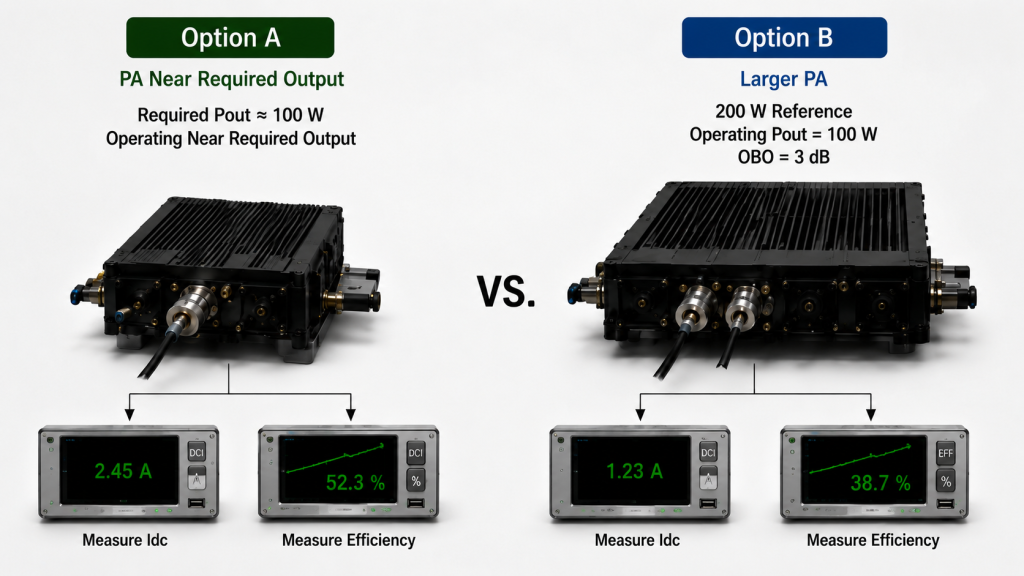
Suppose a project needs approximately 100 W at the defined PA output reference plane.
One option is a PA operating relatively close to that required output.
Another is a 200 W-rated PA operated at substantial back-off.
If 200 W is the agreed output reference, operating at 100 W represents approximately 3 dB OBO.
The larger module may provide additional RF power margin, but that margin should not be evaluated from rated watts alone. The engineer should also verify actual current and efficiency at the intended 100 W operating point.
Consider this illustrative module DC-to-RF efficiency calculation:
At 200 W output and 40% module DC-to-RF efficiency:
Pdc = 200 W / 0.40 = 500 W
At 100 W output and 25% module DC-to-RF efficiency:
Pdc = 100 W / 0.25 = 400 W
In this illustrative calculation, RF output is reduced by 100 W, while the calculated DC input power also falls by only 100 W—from 500 W to 400 W.
The example is not RF SKYPOWER product test data, and it does not prove that a particular PA will follow this curve.
It demonstrates why a 50% reduction in RF output should not automatically be interpreted as a 50% reduction in DC input power.
The example also should not, by itself, be used as a complete heat-dissipation calculation.
Thermal analysis requires a clearly defined energy boundary together with the applicable RF input and auxiliary electrical loads.
If cabinet heat is the engineering decision, calculate RF PA heat load from efficiency using the appropriate electrical boundary instead of assuming that RF output percentage directly determines thermal load.
The selection question is therefore not simply:
“Which PA has more rated watts?”
It is:
“Which PA provides the required RF margin while maintaining acceptable electrical behavior at the OBO points the system will actually use?”
This is where a measured back-off curve becomes more useful than a single rated-output percentage.
When comparing RF Power Amplifier Modules, request operating-point evidence whenever the module will spend significant time below its rated or reference output.
A larger PA may still be the correct choice.
But the decision should be based on measured back-off behavior, required RF margin, and system constraints—not on the assumption that running a larger amplifier at half output automatically cuts its electrical or thermal burden in half.
5. What Back-Off Evidence Should the RFQ Require?
“200 W PA, normally used at 100 W” does not define enough information for an engineering comparison.
A stronger RFQ should define both the output reference and the lower operating points that matter in real use.
For back-off-sensitive projects, specify:
- Frequency points: where back-off behavior must be verified.
- Output reference: rated Pout, P1dB, Psat, or another agreed reference.
- Required OBO points: expressed relative to that reference.
- Normal operating Pout: at the agreed RF output reference plane.
- Efficiency metric: module DC-to-RF efficiency, PAE, drain efficiency, or another agreed definition.
- DC boundary: which rails and electrical loads are included.
- Available Pin: at the PA input reference plane.
- IBO where relevant: when RF input back-off is part of the control method or test.
- Vdc and current limit: at the module electrical boundary.
- Waveform: CW or the required modulated signal.
- RF power convention: average, peak, burst, or another agreed measurement convention.
- Duty cycle: including the required operating interval.
- Thermal condition: cold, transition, or stabilized hot-state requirement.
- Load condition: including VSWR boundary where relevant.
- Protection state: what alarms, derating, or shutdown behavior must be recorded.
- Test evidence: the measurements required at every OBO point.
For most comparisons, the evidence should show at least:
Frequency + OBO Reference + OBO + Pin + Pout + Vdc + Idc + Efficiency + Thermal State + Protection Status
The RFQ should also distinguish commanded back-off from unintended derating.
If a 100 W result was obtained because temperature, voltage, load, or protection limited a nominally higher-power operating point, it should not be accepted as evidence of normal commanded 100 W back-off behavior.
A proper back-off test should reproduce the intended lower-output operating point under the agreed RF, electrical, thermal, and load conditions.
FAQ
Does RF PA efficiency always drop at power back-off?
No.
Efficiency can change as output is reduced, and some PA designs may show lower efficiency at certain backed-off operating points, but the direction and magnitude should not be assumed without measurement.
Use the same OBO reference, efficiency metric, electrical boundary, frequency, waveform, RF power convention, load, and thermal criterion when comparing the operating points.
Does half RF output mean half DC current or half heat?
Not necessarily.
A reduction from 200 W to 100 W is approximately 3 dB of output back-off when 200 W is the defined reference, but that does not require DC current, DC input power, or thermal dissipation to fall by 50%.
Measure Vdc and Idc at the backed-off point.
If thermal sizing is the decision, calculate heat using the appropriate electrical and RF energy boundary rather than scaling it directly from Pout.
Should I choose a larger PA and operate it below rated power?
Sometimes, but rated power margin alone is not enough to make that decision.
Compare candidate modules at the OBO points the system will normally use. Check the stated output reference, actual Pout, Pin, Vdc, Idc, efficiency, thermal state, load condition, and protection status before deciding whether the larger PA provides useful margin or simply moves the operating point into a less favorable region.
Conclusion
RF PA power back-off should be verified at defined OBO points referenced to a clearly stated output level, not predicted by scaling rated-output efficiency or current according to the reduction in RF watts.
A PA operating at half its defined output reference does not automatically use half the DC power, draw half the current, or create half the thermal burden. At the same time, efficiency should not be assumed to always decrease whenever output is backed off.
The correct answer comes from measuring the actual operating points under consistent boundaries.
Define whether the reference is rated output, P1dB, Psat, or another agreed point. Keep the efficiency metric, DUT and DC boundary, RF reference planes, frequency, waveform, average or peak power convention, load, thermal criterion, and observation method consistent across the back-off curve.
Then record actual Pin, Pout, Vdc, and Idc, and confirm that the lower output represents commanded operation rather than thermal, supply, load, or protection derating.
For an RFQ, send RF SKYPOWER the required frequency points, output reference, required OBO levels, normal operating Pout, available Pin, DC supply and current limit, waveform and RF power convention, duty cycle, cooling condition, load or VSWR boundary, hot-state requirement, and required test evidence. These conditions allow the PA comparison to be based on the operating points the project will actually use rather than on a single full-power datasheet percentage.