

In CW vs modulated RF amplifier testing, CW results establish a baseline under the recorded conditions; they do not automatically verify performance with a modulated input. Modulated-signal acceptance needs evidence for the required waveform and the particular output, distortion or thermal requirement being assessed.
Two reports showing the same watts may describe different quantities. When comparing RF Power Amplifier Modules for a C-UAS project, an average-power reading alone cannot establish peak handling or signal fidelity. Before requesting another test, the acceptance engineer needs to identify which parts of the existing records remain useful and which claim lacks evidence.
1. What Does Each Waveform Test Actually Prove?
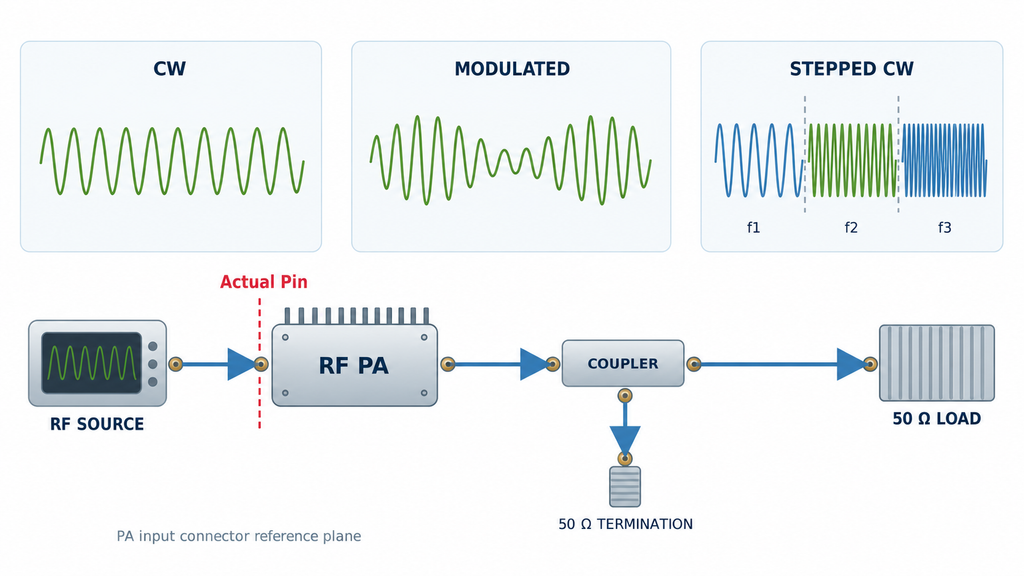
CW means an unmodulated, continuous carrier at a fixed frequency in this comparison. Continuity and modulation are separate properties: a modulated signal can run continuously at 100% duty cycle, and constant-envelope modulation need not have a high peak-to-average power ratio. A report labeled “continuous” therefore does not identify the waveform by itself.
A stepped-frequency CW test records the amplifier at successive fixed frequencies. Those results do not reproduce a waveform whose frequency changes during the measurement interval. Treating both as “swept testing” hides the difference between frequency coverage and behavior under a time-varying stimulus.
The waveform description must also refer to what reaches the PA. The generator setting is not necessarily the actual input power, or Actual Pin, at the PA input connector after the applicable source-path correction. Record the input waveform and its power definition there, rather than assuming that a source setting identifies the stimulus at the amplifier.
For RF power amplifier testing, the result applies to the documented stimulus and operating state. Cross-waveform comparison is still possible: the waveform can be the deliberately changed variable. The other conditions that affect the selected metric must be controlled or their differences recorded. When a report provides only a CW, modulated or swept label, its scope is not yet clear enough to support an equivalence claim.
2. How Do Averaging Windows Change PAPR and Power?
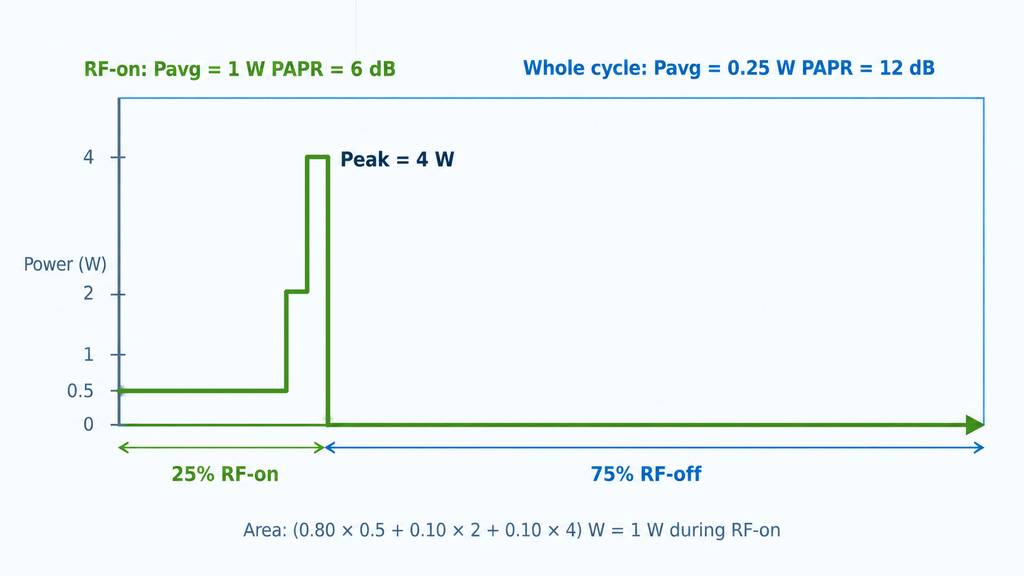
An average taken only while RF is on is different from an average over the complete on/off cycle. For a defined observation interval, the linear-power relationship is:
Pavg,whole = D × Pavg,on + (1 − D) × Pavg,off
Here, D is the RF-on fraction of that interval. Only when off-period RF power is negligible does the expression reduce to D × Pavg,on. Average linear power in watts before converting the result to dBm; averaging dBm readings directly does not produce the same quantity.
Peak-to-average power ratio, or PAPR, compares peak envelope power with average power at the same reference plane and for the same stated observation window:
PAPR in dB = 10 × log10(peak envelope power / average power)
Consider an illustrative waveform at one PA-output reference plane with 1 W average power during RF-on periods, 4 W peak envelope power, 25% duty cycle and negligible off-period RF power. Its whole-cycle average is 0.25 W. The PAPR is approximately 6 dB when calculated within the RF-on periods, but approximately 12 dB when the averaging window includes the off periods. Both calculations use the same 4 W peak; including the off periods lowers the average used in the ratio. These are explanatory values, not RF SKYPOWER measurements or product ratings.
Peak statistics need their own definition. State the capture duration, time gating and measurement bandwidth, and distinguish a maximum observed in a finite record from a statistical threshold. A complementary cumulative distribution function, or CCDF, gives the probability of exceeding a stated power level relative to the applicable average. A CCDF result must identify that probability and whether the calculation includes off periods; a percentile is not an unlimited-duration peak guarantee.
For ideal CW, envelope PAPR is 0 dB. That statement concerns the RF envelope, not the ratio between the instantaneous carrier-voltage peak and its RMS value. Before comparing reported crest factors or PAPR values, identify the convention, window and reference plane. Missing definitions may be recoverable from the original capture; without them, the numbers should not be treated as directly comparable.
3. What Does Matching Average or Peak Power Leave Unproven?
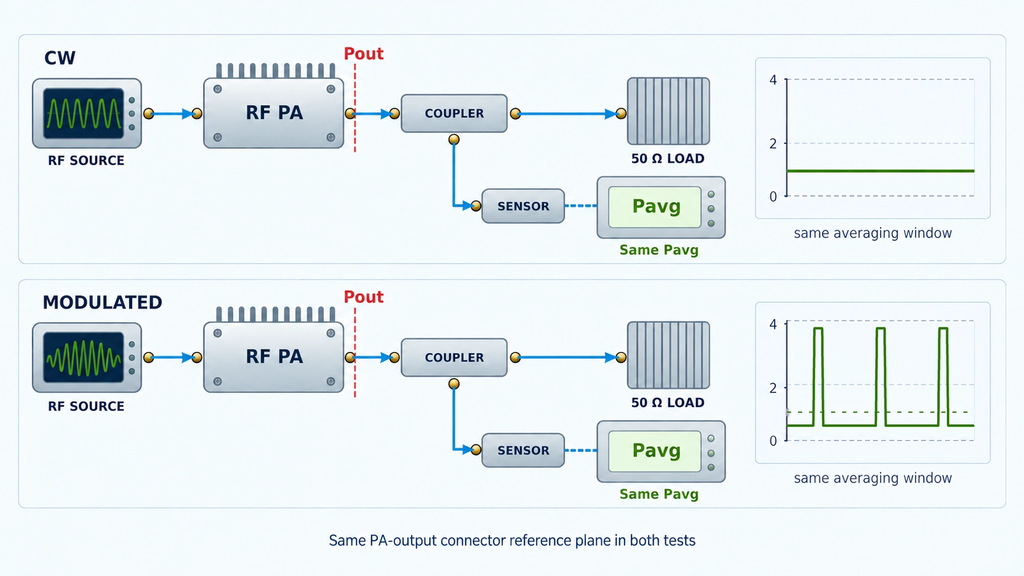
Choose the quantity that answers the acceptance question before adjusting a comparison to make two displays agree. Matching average output, peak envelope output or actual average input creates three different tests. In each case, control the other relevant conditions or record their differences, including whether input drive was held fixed or adjusted.
| Quantity held equal | What the comparison can show | What it does not establish |
|---|---|---|
| Average Pout at the PA output reference plane, using the same averaging window | How the measured peak behavior and other recorded results differ at that average output | Equal peak envelope power, distortion or thermal load |
| Peak envelope Pout at the PA output reference plane, using a qualified peak measurement | How average output differs when the observed envelope peaks are matched | Equal average power delivery, duty cycle or heating |
| Actual average Pin at the PA input reference plane, using the same averaging window | How the amplifier’s measured input-to-output behavior differs between waveforms | Equal Pout or a common usable-output limit |
A CW 1 dB gain-compression point, P1dB, and saturated output power, Psat, characterize their stated test conditions. Neither is automatically a modulated average-power rating. Subtracting a waveform’s PAPR from a CW power figure does not establish guaranteed usable modulated output: the reference power, waveform statistics and acceptable distortion still need corresponding evidence. Even output back-off is meaningful only when its reference and power definition are stated.
A lower output PAPR is not automatically an improvement. It may be consistent with compression of envelope peaks rather than faithful amplification. Compare the applicable input and output records, then assess the signal-quality requirement itself. Error vector magnitude, or EVM, requires a defined reference modulation and demodulation method; adjacent-channel leakage ratio, or ACLR, requires defined measurement and adjacent-channel bands. These metrics are relevant only where the acceptance requirement calls for them. There is no single distortion limit that this comparison can assign to every C-UAS RF waveform.
Where only a CW rating or compression record is available, retain that baseline and obtain waveform-specific output and applicable distortion evidence before assigning a usable modulated average-power result.
4. Can the Measurement Chain Capture the Required Signal?
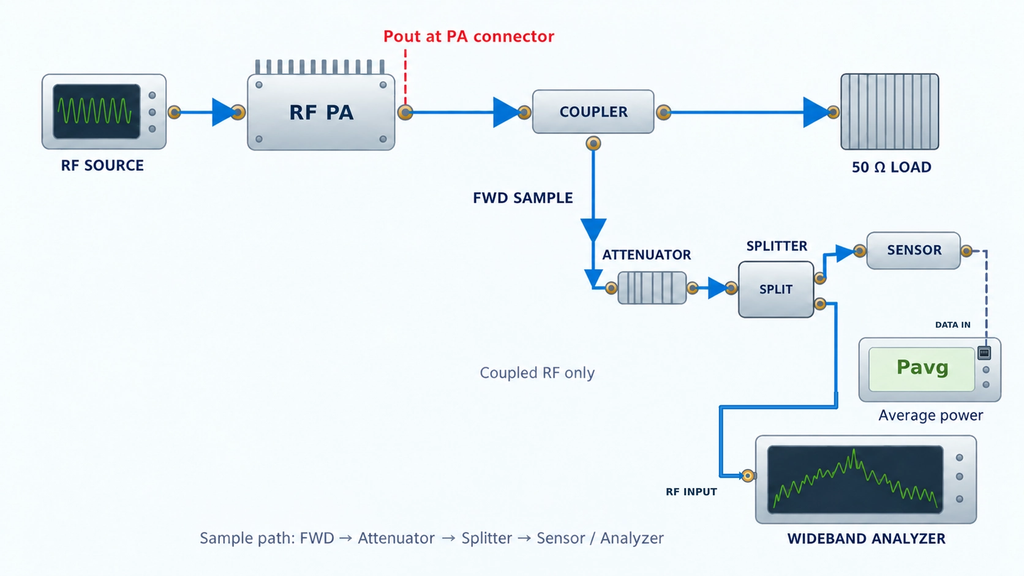
A sensor can provide a valid average-power reading without being able to measure envelope peaks. Its RF frequency range describes a different capability from its envelope response. Likewise, a current calibration record does not by itself establish that the measurement mode can follow the required envelope or capture brief peaks.
Qualify the measurement against the quantity being claimed. For average power, check the applicable sensor or analyzer mode and averaging window. For peak envelope power, check the dynamic response, capture settings and peak-detection method. Keep the signal within the measurement chain’s applicable limits; an overloaded sensor or missed peak cannot provide valid peak-acceptance evidence simply because the displayed average looks reasonable.
Channel power is an integrated result over a defined frequency interval. A single spectrum-analyzer marker in one resolution bandwidth is not equivalent to the power across a modulated channel. The integration bandwidth, detector and averaging method must suit the signal and the reported quantity. Otherwise, two instruments may disagree because they are measuring different portions or different statistics of the same signal.
The path correction also has to cover the signal being measured. A correction established at one frequency may be insufficient when path response varies materially across the occupied spectrum. Retain the raw reading, applicable correction, uncertainty and the defined PA reference plane; do not label the sensor reading as corrected PA output without that relationship.
Identify whether the measurement channel supports the average-power comparison, the peak comparison, the spectral assessment, or only a specified subset. A missing peak capability invalidates the peak claim, not automatically every other correctly measured quantity. Obtain the missing result with a qualified method before using it for acceptance.
5. Why Can Equal RF Watts Produce Different Thermal Results?
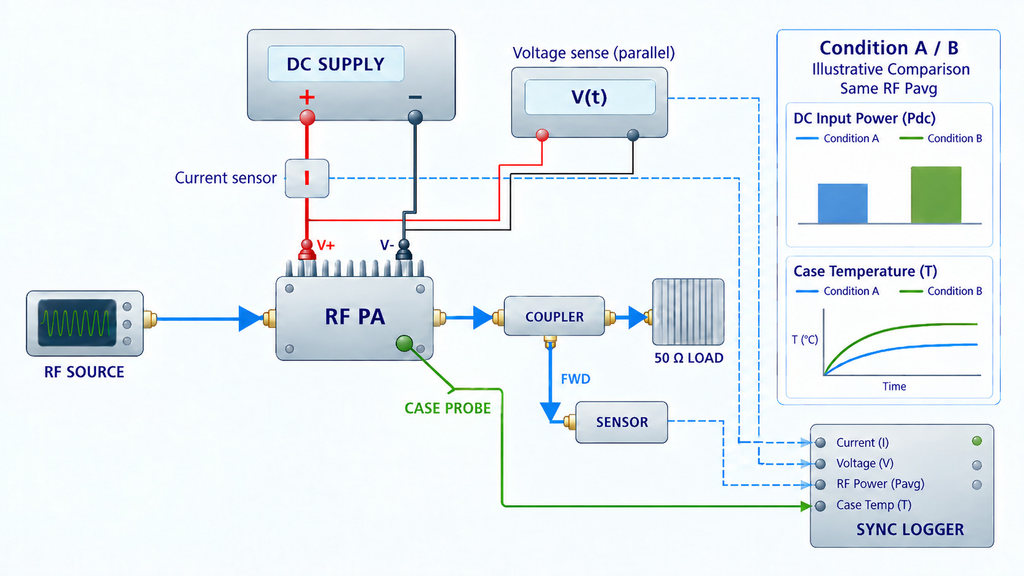
Equal average RF output does not establish equal heat dissipation. The amplifiers may draw different electrical power, and the energy balance includes RF input as well as output. Define the boundary being assessed: which supply rails and auxiliary loads are included, where RF power enters and leaves, and whether the data represent a thermal transition or a stabilized condition.
For time-varying electrical demand, average the product v(t) × i(t) over the relevant interval. Multiplying separately averaged voltage and current is not generally equivalent. Include RF-off periods when evaluating a complete operating cycle: an amplifier may remain biased and consume electrical power while little or no RF leaves its output. RF duty cycle alone therefore does not determine electrical consumption or heat.
Compare synchronized RF and electrical records over the same operating interval, with the actual cooling conditions, temperature measurement point and thermal history documented. A case-temperature reading is not a junction-temperature measurement. A CW thermal observation window needs a defined stability criterion; applying the same discipline to the modulated test does not mean assuming that both tests reach the same temperature.
With only average RF output or a temperature snapshot, thermal equivalence remains unproven. The missing evidence is the corresponding electrical-power and thermal-state record, not an arbitrary additional warm-up time. Neither waveform is necessarily the hotter case in every amplifier or operating condition.
6. Which Results Can Support the Acceptance Decision?
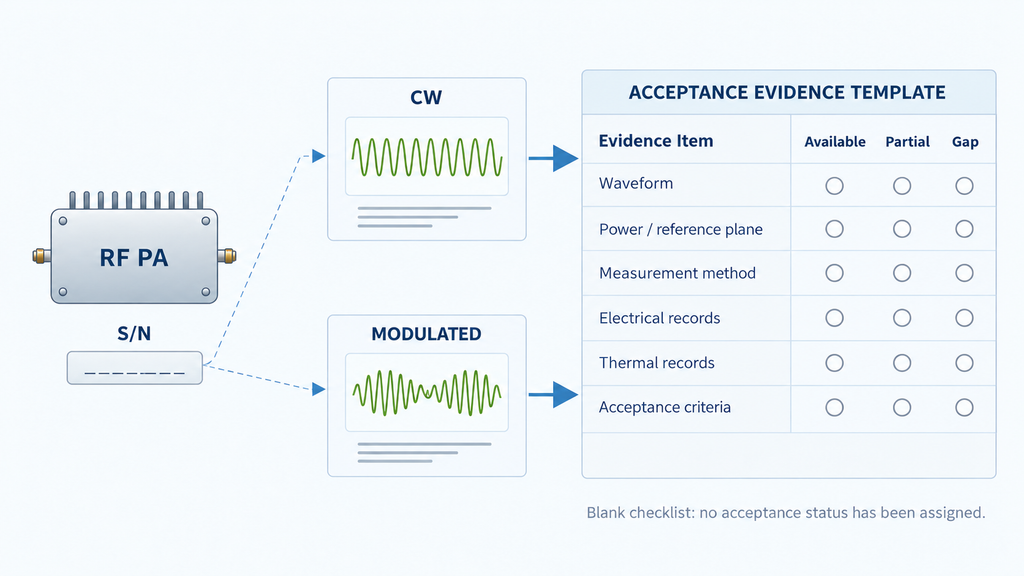
Judge comparability for each acceptance requirement, rather than assigning one verdict to the entire report. Results can support a direct comparison for a specified metric when its definition, measurement method and relevant conditions align. Where only part of the evidence aligns, use only that overlapping scope. Where a critical definition or measurement qualification is missing, the corresponding comparison remains unresolved.
Use the two reports to complete a comparison record with the following evidence. An empty item identifies what to recover from the original records or obtain through an appropriate additional measurement; it is not permission to infer a result.
| Record item | Evidence needed in both reports | What a gap prevents |
|---|---|---|
| Test object and scope | Unit identity, configuration and the frequencies or operating conditions actually covered | Applying a result to a different unit, configuration or untested scope |
| Waveform identity | Actual input waveform, frequency, occupied bandwidth and on/off behavior | Establishing which stimulus the result represents |
| Power and statistics | Average and peak definitions, reference planes, averaging windows, and peak or CCDF capture definitions | Comparing same-named power or PAPR values directly |
| Fixed quantity and drive | The quantity held equal, Actual Pin, and whether drive was fixed or adjusted | Knowing which comparison question the records answer |
| Measurement capability | Applicable modes, dynamic response, frequency integration, correction and overload checks | Using a reading for a metric the measurement chain cannot support |
| Electrical and thermal state | Time-aligned electrical and RF records, included loads, cooling, temperature point and thermal-state criterion | Claiming equal heat dissipation or thermal margin |
| Acceptance basis | The approved requirement, applicable limit, uncertainty treatment and decision rule | Declaring acceptance merely because two readings agree |
Acceptance limits and any guard-band treatment must come from the applicable specification or agreed acceptance procedure. This comparison does not create them. A missing modulated test is not, by itself, a failed amplifier; equally, an acceptable CW power reading is not evidence that every modulated-signal requirement has been met.
Where the project requires unit-level acceptance, specify a One Report One Unit relationship: the delivered unit’s serial number must connect to its test dataset and report under the required conditions. A representative sample report cannot establish the result for another delivered unit or an entire batch. Broader shipment acceptance evidence must identify its own unit, configuration and batch scope. PA-port measurements also do not establish installed-system effectiveness.
Conclusion
Use CW results for the baseline they actually establish, and use measurements of the required modulated waveform for the corresponding acceptance claims. Compare a named power quantity over defined time and statistical windows, with a qualified measurement method and the relevant operating conditions recorded. Equal average watts do not establish equal peaks, distortion or thermal margin.
This comparison can identify which requirements an existing report supports and where evidence is missing. It cannot assign a model-specific modulated rating, a universal back-off value or a project acceptance limit. First compare the reports requirement by requirement, retain the valid CW evidence, and identify the smallest missing record or measurement needed to resolve each unsupported claim.
For a module configuration review, contact our engineering team with the waveform definition, frequency and occupied bandwidth, average and peak power with their observation windows, and the comparison record and required acceptance limits. These inputs define the configuration and supporting test documentation to discuss without assuming a product has already met the requirement.