
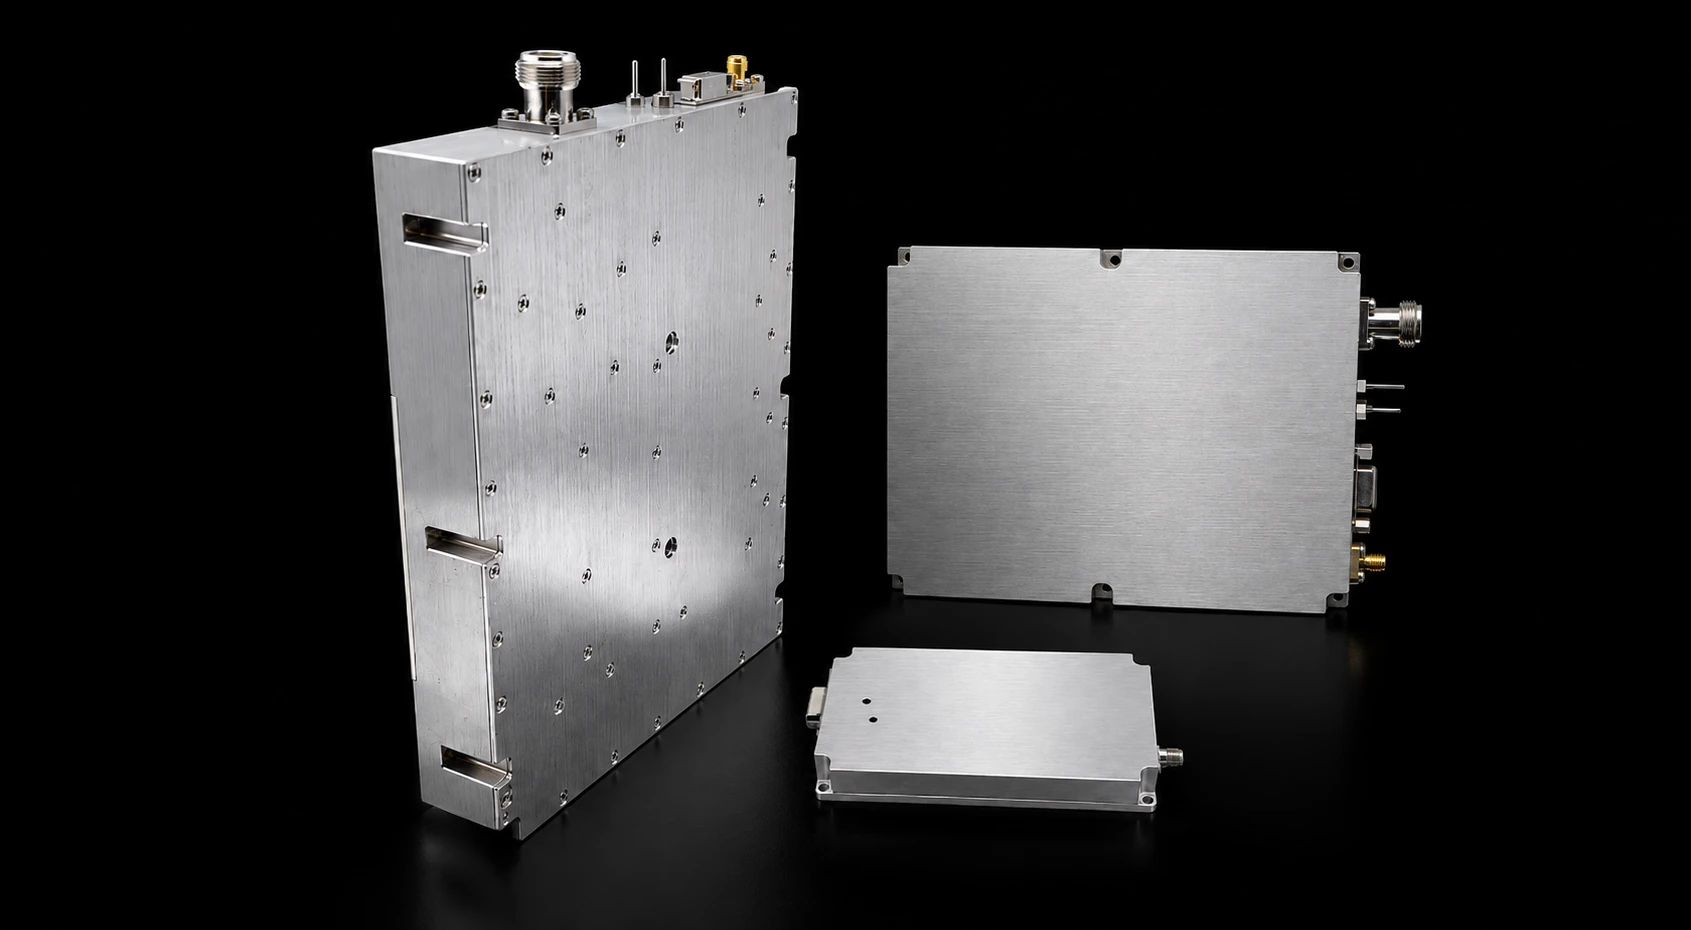
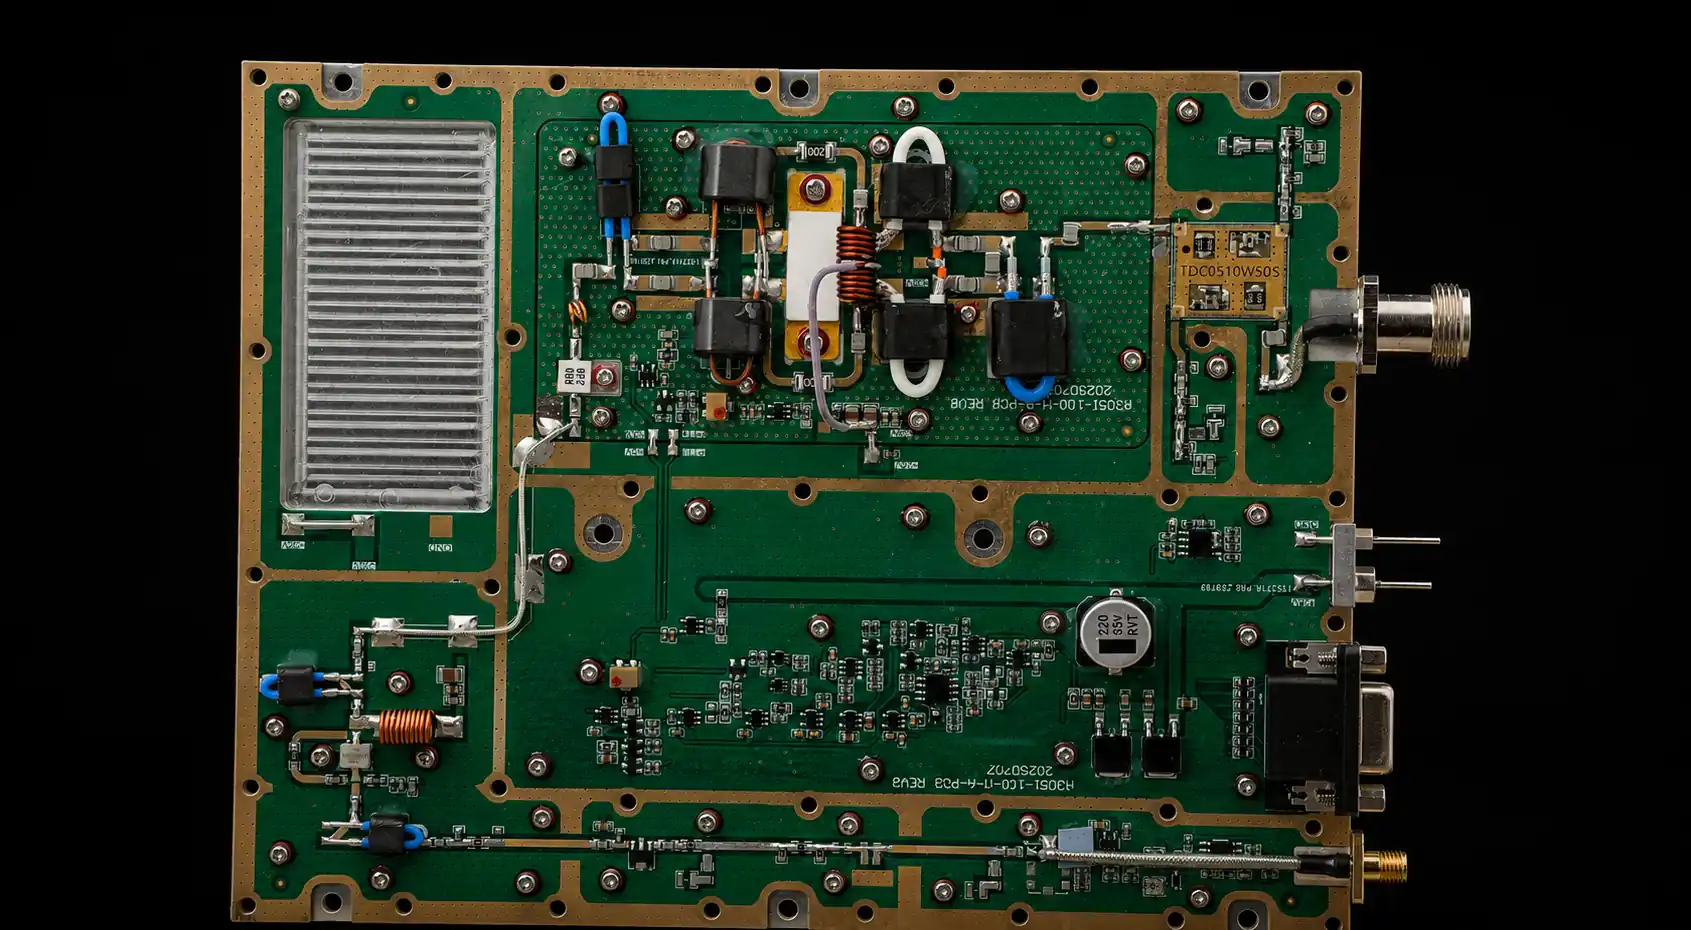
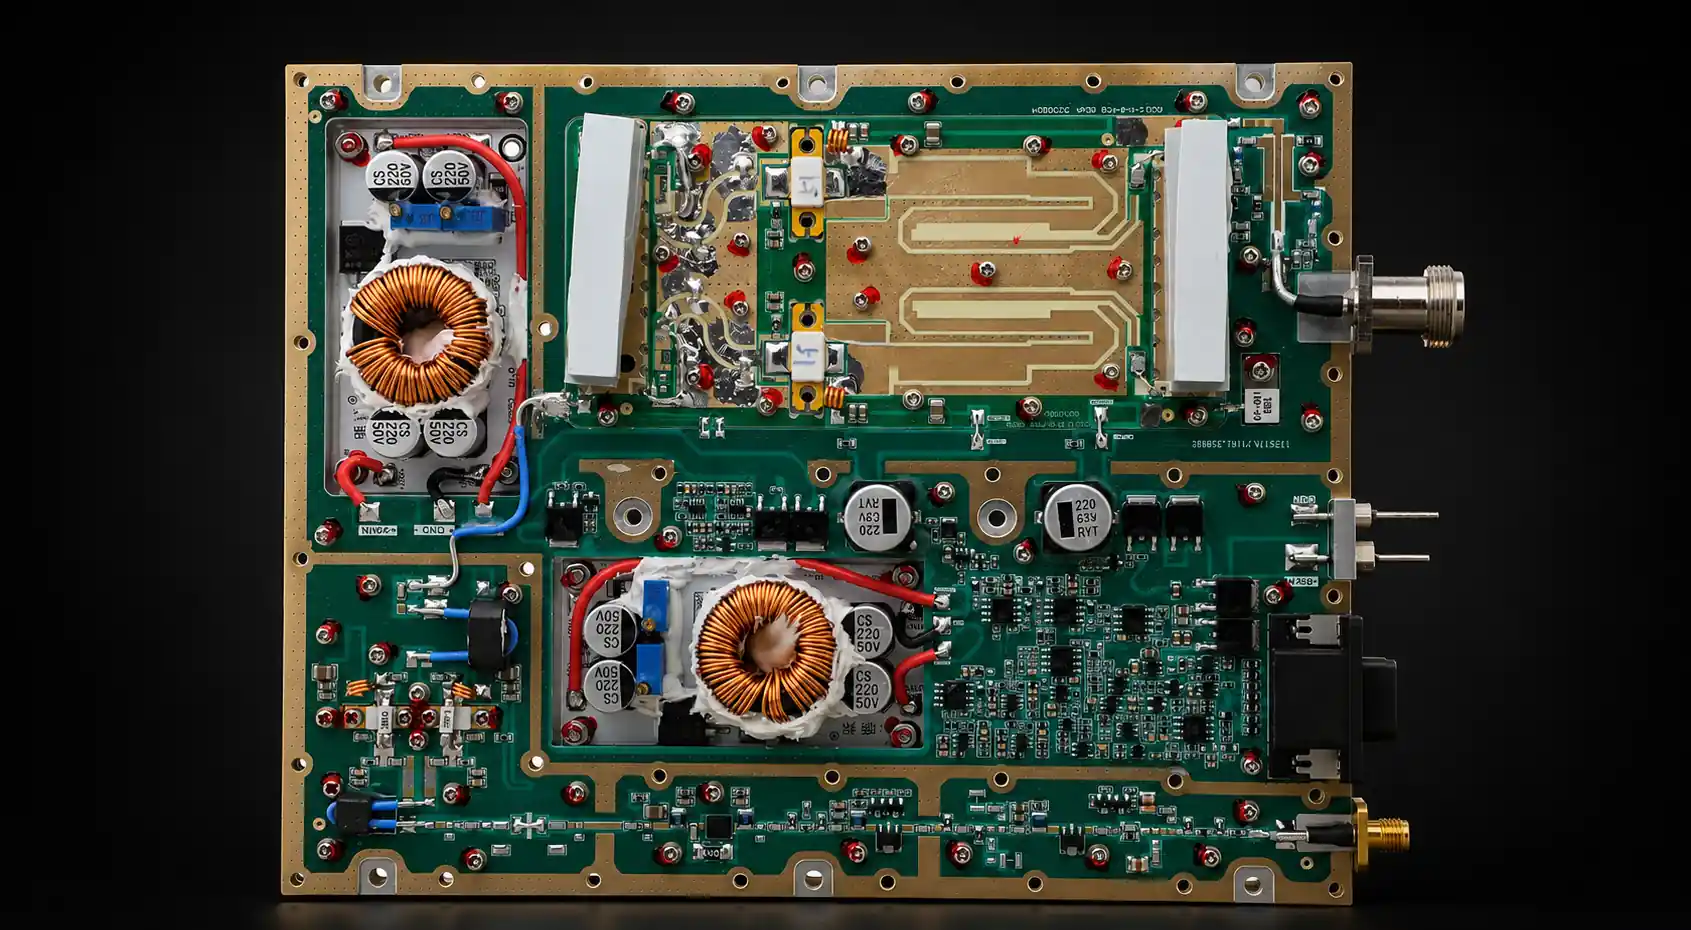
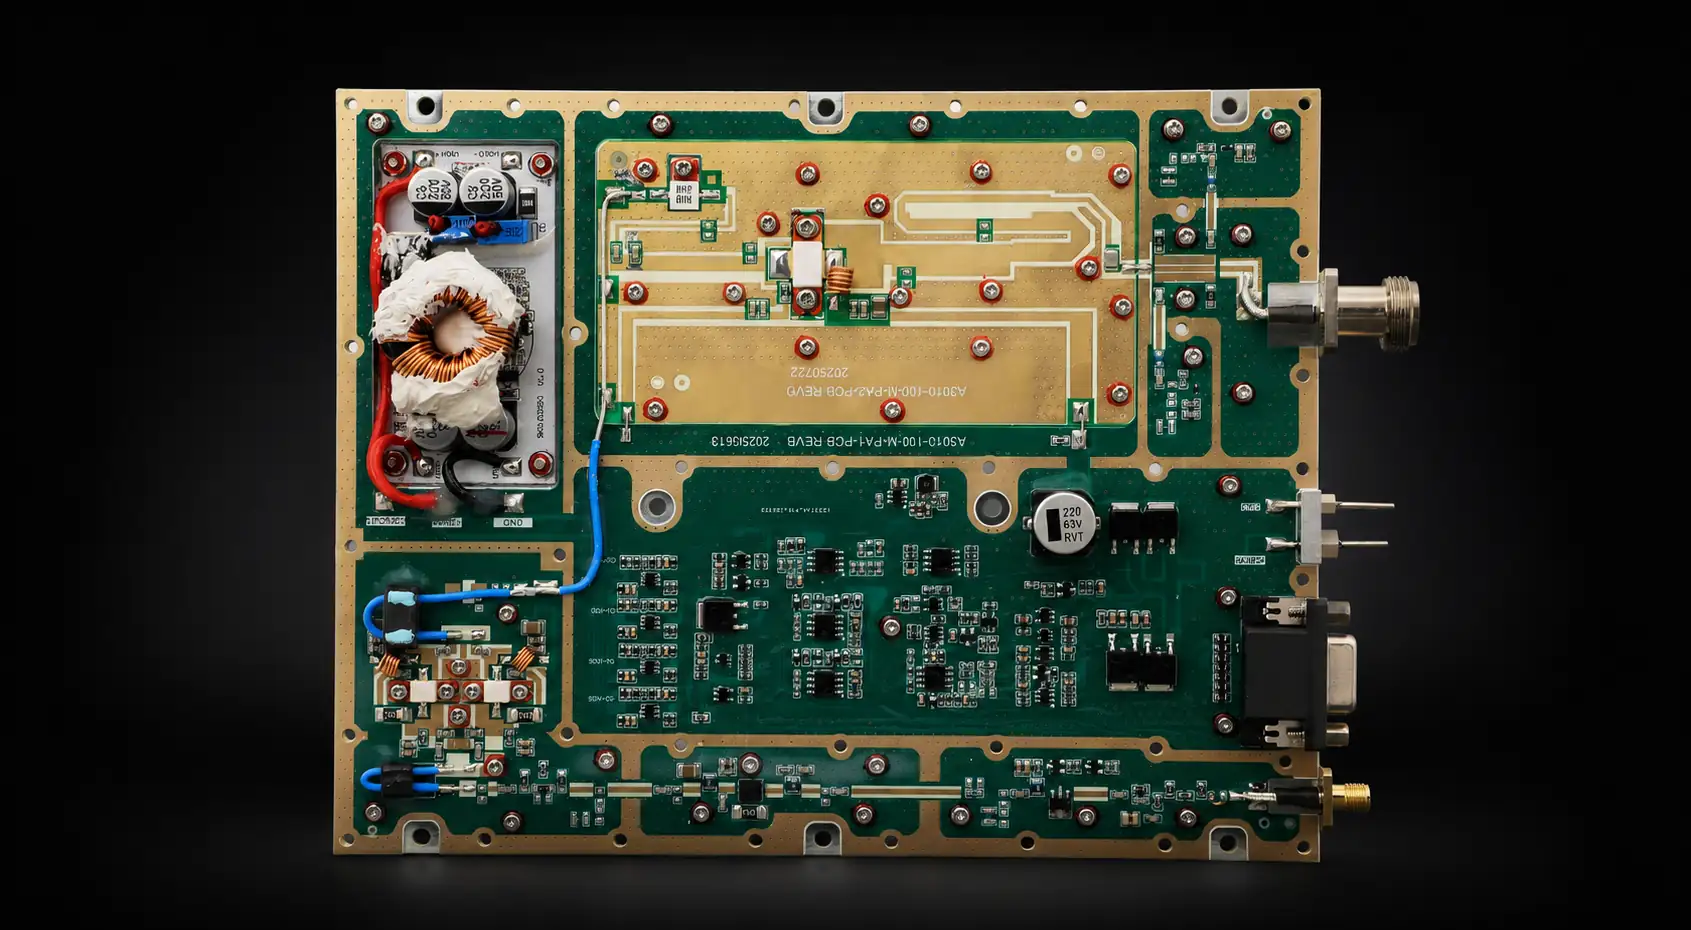



RF PA gain flatness can look acceptable across the specified band and still leave one project-critical C-UAS frequency with less usable output than another. Engineers may reuse the same nominal SDR or signal-source setting at several test frequencies and still measure different RF PA output at each point.
One frequency may reach the required output with comfortable margin. Another may require more RF input power, move closer to compression, run hotter, or trigger protection earlier.
RF PA gain flatness may explain part of this difference, but it is not the only possible cause.
The signal source may not deliver the same verified output at every frequency. The input path may introduce frequency-dependent loss. PA-terminal voltage may fall under load. Large-signal gain and available output margin may change after heat builds. Components after the PA output connector may also introduce loss, mismatch, or protection foldback.
This article focuses on one RF PA and its defined input and output path evaluated at several required frequency points. It does not assume that every C-UAS band uses the same PA architecture or operates simultaneously.
Before approving wideband RF Power Amplifier Modules, the project should establish a controlled PA-port baseline and determine where the weak result begins.
The key question is:
Does the lower output come from RF PA gain variation—or from the signal source, input path, operating condition, load, or installed RF path?
1. Why the Same Nominal Drive Setting Can Produce Uneven Output
RF PA gain describes the relationship between input power and output power under a defined operating condition.
When both values are expressed in dBm:
Gain = Pout − Pin
If actual RF input power at the PA connector, or Pin, remains constant while gain changes across frequency, corrected RF output power, or Pout, also changes.
In a linear comparison, a PA receiving 0 dBm at its input would theoretically produce:
- 50 dBm output at 50 dB gain;
- 47 dBm output at 47 dB gain.
A 3 dB reduction corresponds to approximately half the RF output power.
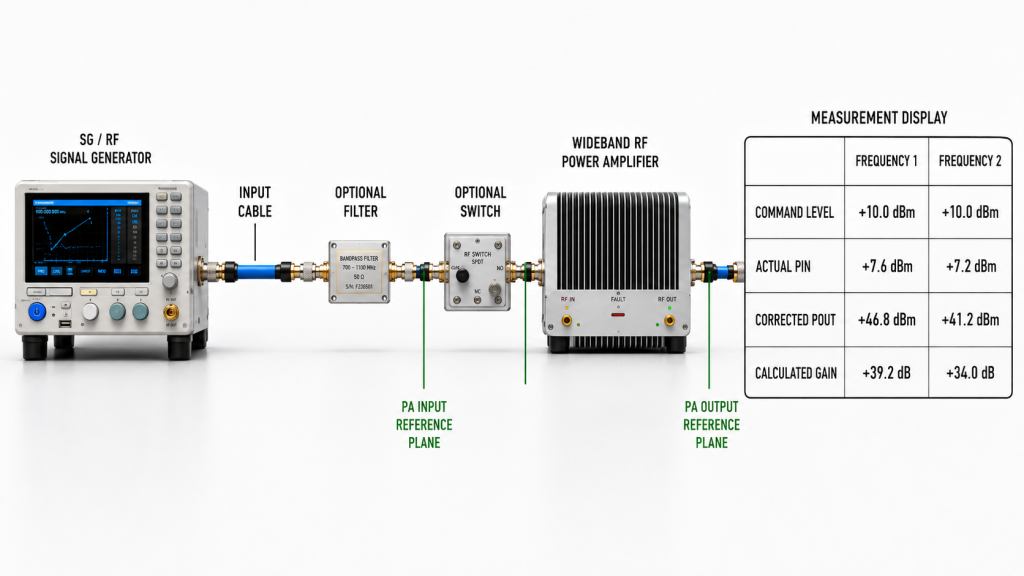
This is why a local gain dip can matter even when the overall curve appears acceptable. A frequency with several decibels less gain may require more input power or deliver less output under the same input condition.
However, the SDR or signal-generator setting does not necessarily show the actual power reaching the PA input connector.
The difference may begin with:
- source-amplitude variation across frequency;
- source calibration uncertainty;
- interconnection cable loss;
- adapters or connectors;
- filters;
- RF switches;
- splitters or couplers;
- other frequency-dependent components.
A source commanded to deliver the same level at two frequencies may therefore produce different verified source output. The input path may then introduce additional frequency-dependent loss.
Comparing only the nominal source setting can incorrectly assign the output difference to PA gain flatness.
Keep the Reference Planes Consistent
Gain can only be compared correctly when Pin and Pout use clearly defined reference planes.
For a module-level test, a practical boundary is:
- Pin measured or corrected to the PA input connector;
- Pout measured or corrected to the PA output connector.
If Pin comes from the source display while Pout is corrected to the PA output connector, the calculation may include unrecorded input-path loss.
The resulting gain value cannot be compared reliably across frequency or between test setups.
Gain Is No Longer Constant Near Compression
The gain equation remains valid near full power, but the gain value is no longer constant.
As the PA enters compression, an increase in Pin produces a smaller increase in Pout. One frequency may enter compression earlier than another because matching, bias conditions, device behavior, thermal state, or PA-terminal voltage margin vary across the band.
A low-level gain sweep can identify the general frequency response without proving the required high-power output at every critical point.
2. What Gain Flatness Can—and Cannot—Explain
Gain flatness shows how consistently an RF PA amplifies signals across a defined frequency range under stated conditions.
It can help identify:
- gradual gain change across the band;
- local gain dips;
- stronger and weaker frequency regions;
- band-edge loss of margin;
- frequencies that require more input drive;
- points that may become weak near compression or after heat builds.
But gain flatness is a diagnostic indicator, not a complete system-acceptance result.

Gain Flatness Is Not the Same as Output Flatness
A PA may show relatively stable small-signal gain while its available output capability changes across frequency.
This can happen because:
- compression begins at different input levels;
- high-power efficiency changes across the band;
- DC and thermal margins are not uniform;
- protection thresholds are approached at different points.
Gain flatness and output flatness are related, but they answer different questions.
A gain result asks:
How evenly does the PA amplify the input signal?
An output result asks:
How much corrected RF power does the PA deliver under the required operating condition?
A project that depends on stable output across several required frequencies normally needs both forms of evidence.
A PA-Port Result Does Not Prove Antenna-End Power
Module gain should first be evaluated at the PA connectors under a defined load.
Power at the antenna input may also be affected by:
- directional couplers;
- filters;
- RF switches;
- feeder cables;
- connectors and adapters;
- surge-protection devices;
- antenna matching;
- installation-dependent VSWR.
A weak antenna-end result may begin with a gain dip inside the PA. It may also come from loss or mismatch after the PA output connector.
Those causes should not be combined into one unexplained result.
Gain Flatness Does Not Prove Channel Acceptance
A C-UAS system may use different input settings, PA models, feeder paths, antennas, or acceptance limits for different channels.
The final question is not whether every frequency has identical gain.
The project must determine whether each required point can meet its output target without exceeding:
- available RF input-power margin;
- PA output capability;
- DC supply boundary;
- thermal limit;
- load or VSWR boundary;
- protection threshold.
A frequency can have lower gain than another point and still be acceptable if it maintains the required output with sufficient operating margin.
3. How to Separate Gain Variation from Input-Path and Installed RF-Path Loss
A gain-flatness problem should only be assigned to the PA after actual Pin and the PA-port reference planes have been controlled.
When one frequency produces lower output, begin at the signal source and PA connector boundary. Change one condition at a time.
Changing the input path, thermal state, load, and installed RF path together makes the real cause harder to isolate.
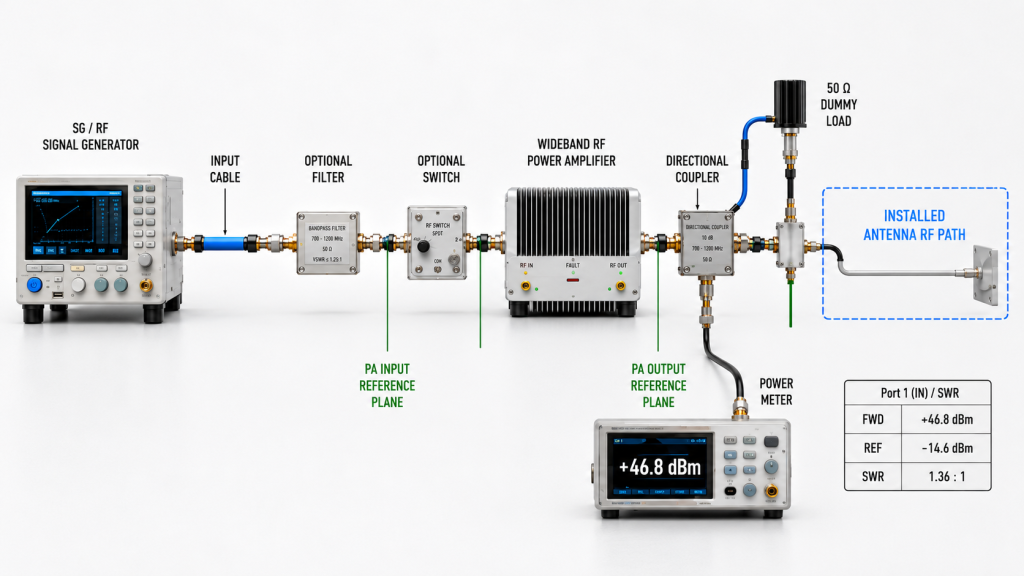
Step 1: Verify the Source and Actual Pin
Do not rely only on the nominal SDR or signal-generator setting.
Record or verify:
- commanded source level;
- verified source output or calibration status;
- cable and adapter loss;
- filter or switch loss;
- attenuator or coupler loss;
- actual Pin at the PA input connector.
If actual Pin is already lower at the weak frequency, correct the source or input-path difference before judging the PA.
This is the first diagnostic stopping condition:
If actual Pin is not controlled, the result cannot yet be assigned to PA gain flatness.
Step 2: Measure Corrected Pout at the PA Output
The result should state where Pout is referenced.
If the output measurement path includes a cable, attenuator, coupler, connector, or sensor correction, record the total correction applied to the instrument reading.
Without a defined output reference plane, engineers cannot separate PA behavior from test-path loss.
Step 3: Calculate Gain Under the Same Operating State
Use actual Pin and corrected Pout from the same frequency, reference planes, and operating state.
Compare:
- low-band point;
- center frequency;
- high-band point;
- project-critical points;
- known local dips;
- any frequency that previously showed low output.
If actual Pin is controlled and lower Pout produces lower calculated gain, determine when the reduction appears.
It may already be visible during a small-signal sweep. It may appear only near the required output as the PA enters compression. It may also develop after thermal stabilization.
This establishes the second diagnostic condition:
If controlled PA-port Pin, corrected Pout, or calculated gain fails the defined limit, continue investigating the PA and its DC, thermal, and load boundaries.
Step 4: Establish the PA-Port Operating Baseline
Before adding the installed RF path, record the PA-port result under a defined load.
Check:
- PA-terminal DC voltage;
- operating current;
- cooling condition;
- case or baseplate temperature;
- test duration;
- cold-state or stabilized hot-state condition.
A frequency operating with lower efficiency, greater internal dissipation, or less voltage and thermal margin may lose output earlier during continuous operation.
Step 5: Add the Installed RF Path Separately
After establishing the PA-port baseline, connect the installed RF path and compare the result.
Record:
- forward power;
- reflected power;
- VSWR;
- feeder loss;
- filter or switch loss;
- antenna-path condition;
- protection or alarm status.
This establishes the third diagnostic condition:
If PA-port Pin, corrected Pout, and calculated gain meet their defined limits but antenna-end power does not, move the investigation downstream of the PA output connector.
Same Output Problem, Different Possible Causes
| Observed Symptom | Possible Cause | Evidence Needed |
|---|---|---|
| Lower Pout at one frequency | Lower PA gain | Actual Pin, corrected Pout, and calculated gain |
| Same nominal source setting but different Pout | Source-amplitude variation or frequency-dependent input-path loss | Verified source output and actual Pin at the PA input connector |
| Small-signal gain looks similar, but full-power capability differs | Earlier compression or lower output margin at one frequency | Pout-versus-Pin data at the PA connectors and required frequencies |
| Pout falls after warm-up | Thermal drift, PA-terminal voltage drop, compression, or protection behavior | Hot-state Pout, Vdc, Idc, temperature, and protection status |
| PA-port result passes but antenna-end result is low | Feeder, filter, switch, connector, or installed RF-path loss | Path correction, FWD, REV, and VSWR |
| Output falls after the installed RF path is connected | Mismatch or protection foldback | Reflected power, VSWR, alarm, and protection status |
The same field symptom can come from several causes. A single power-meter screenshot or one typical gain value cannot distinguish them.
Once PA-port Pin, corrected Pout, and calculated gain meet the defined limits, any remaining antenna-end deficit should be investigated downstream of the PA output connector.
4. How Drive, Compression, and Heat Change the Weakest Frequency
Gain flatness should not be reviewed without defining the input level, output level, and thermal state.
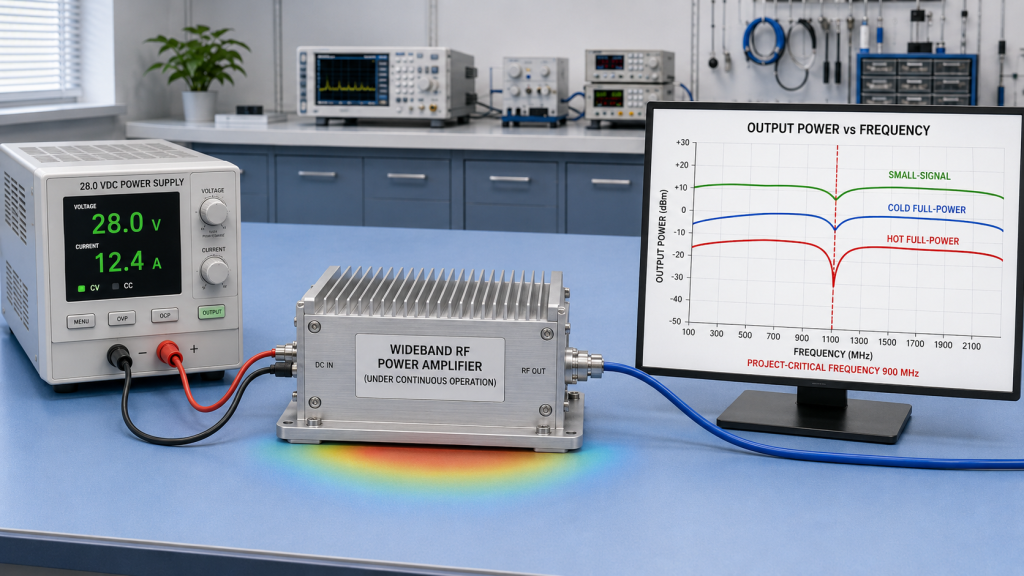
A frequency that looks acceptable during a small-signal sweep may become the weakest point near the required output or after heat builds.
Small-Signal Flatness May Hide a Full-Power Weak Point
During a small-signal sweep, the PA operates well below its output limit.
This test can identify:
- broad frequency response;
- obvious gain ripple;
- band-edge roll-off;
- local low-gain regions.
But it does not prove that every point can produce the required output.
At higher drive, one frequency may:
- enter compression earlier;
- need more Pin to approach the target;
- operate with lower efficiency;
- develop greater internal dissipation;
- stop increasing Pout as expected;
- approach a protection boundary.
The weakest full-power frequency may therefore differ from the lowest point on the small-signal gain curve.
Fixed-Input and Target-Output Tests Answer Different Questions
A fixed-input comparison applies the same actual Pin at each frequency.
It shows:
- gain variation;
- output variation under equal-input conditions;
- which points respond more or less strongly;
- where input-drive compensation may be required.
A target-output test adjusts Pin within the allowed input limit to determine whether each frequency can reach and maintain its required Pout.
It shows:
- how much RF input power each point requires;
- whether the SDR or driver has enough margin;
- whether the PA enters compression before reaching the target;
- how PA-terminal voltage, current, and temperature change;
- whether the target can be reached and maintained without exceeding the defined input, thermal, or protection boundary.
Neither test should silently replace the other.
The test report must state which method was used.
Heat Can Move the Weakest Point
A short cold-state sweep may pass before the PA, DC path, cooling interface, and load reach thermal stability.
After warm-up:
- large-signal gain may change;
- required Pin may increase;
- Pout may decrease;
- PA-terminal voltage may fall;
- efficiency may change;
- protection may reduce output;
- another frequency may become the lowest-margin point.
This can become more visible in compact vehicle-mounted cabinets, where airflow, DC cable length, connector resistance, and cabinet temperature may differ from laboratory conditions.
The same risk also applies to rooftop, airport, border, fixed-site, and other long-duty installations.
A swept-frequency full-power RF PA test should confirm whether the weak frequency remains visible when actual Pin, reference planes, load, thermal state, and protection status are controlled.
5. What Evidence Shows Whether Gain Flatness Is the Real Cause
The purpose of the evidence is not to prove that every frequency has identical gain.
It is to determine whether gain variation explains the lower output and whether every required point still has sufficient usable margin.

Use Project-Critical Frequency Points
Do not approve the module only from one center-frequency result.
The review should include:
- low edge;
- center frequency;
- high edge;
- project-critical points;
- known local gain dips;
- any frequency that previously showed reduced output.
A sweep can show the overall curve. Defined point measurements can then provide detailed evidence where the project actually depends on the PA.
Connect Input, Output, and Operating State
For each critical point, connect:
- verified source output;
- actual Pin at the PA input connector;
- corrected Pout at the PA output connector;
- calculated gain;
- PA-terminal voltage and current;
- cold-state or stabilized hot-state condition;
- defined load and cooling condition.
Where the installed RF path is part of the test, review FWD, REV, VSWR, and protection status separately from the PA-port baseline.
This evidence can show whether the weak result comes from:
- source-amplitude variation;
- input-path loss;
- lower PA gain;
- compression;
- PA-terminal voltage drop;
- thermal change;
- installed RF-path loss;
- mismatch or protection foldback.
Judge Each Frequency Against Its Required Output
A frequency can have lower gain than another point and still be acceptable if it reaches and maintains the required output with sufficient input, voltage, thermal, and protection margin.
Another frequency may show only a small gain difference but still fail because available Pin is limited or the PA enters compression too early.
Final RF power consistency across C-UAS channels should therefore be judged against each channel’s own target and operating boundary, not from gain flatness alone.
Before quotation or approval, the project should define:
- required frequency points;
- available RF input power at the PA connector;
- minimum corrected Pout;
- allowed gain variation;
- thermal state;
- load condition;
- test duration;
- required reporting scope.
More detailed gain-flatness checks before RFQ can then define the test method, acceptance limit, and reporting scope.
FAQ
Does Good Gain Flatness Prove Equal Output Across C-UAS Frequencies?
No.
Good gain flatness makes output behavior more predictable, but full-power output can also be affected by verified source output, actual Pin, compression, PA-terminal voltage, thermal state, load, installed RF-path loss, VSWR, and protection behavior.
Gain and output should be reviewed under the same defined conditions.
Should Every Frequency Be Tested with the Same Input Drive?
It depends on the test objective.
Use the same actual Pin when comparing gain and output response under equal-input conditions.
Adjust Pin within the allowed input boundary when checking whether each frequency can reach its target output and how much input margin it requires.
A complete approval plan may need both methods.
What Should Be Repeated After Thermal Stabilization?
Repeat the project-critical points under the same load and cooling condition.
Compare verified source output, actual Pin, corrected Pout, calculated gain, PA-terminal voltage, current, temperature, and protection status against the cold-state baseline.
Include FWD, REV, and VSWR when the installed RF path is part of the test.
Conclusion
Lower output should only be attributed to RF PA gain variation when actual Pin is controlled, the PA-port reference planes are consistent, and reduced Pout appears as reduced calculated gain under the same operating state.
If the PA-port result remains within its defined limits, the investigation should move downstream to the installed RF path.
The same nominal SDR or signal-source setting does not guarantee the same verified source output or actual Pin at every frequency. Even when actual Pin is controlled, large-signal gain and available output margin can vary with frequency, drive level, and thermal state.
The project does not need perfectly identical gain at every point. It needs sufficient usable output margin at every required frequency—and evidence that shows where any difference begins.
RF SKYPOWER can support early engineering review for multi-band gain-flatness risk.
Submit the required frequency points, target PA-port output, and available RF input power at the PA connector.
Also define the 28 V supply condition, duty cycle, cooling method, test load, installed antenna path, allowed gain and output variation, VSWR boundary, and test-report requirement.
The review can then define the fixed-input, target-output, full-power, and hot-state evidence needed before module approval.