

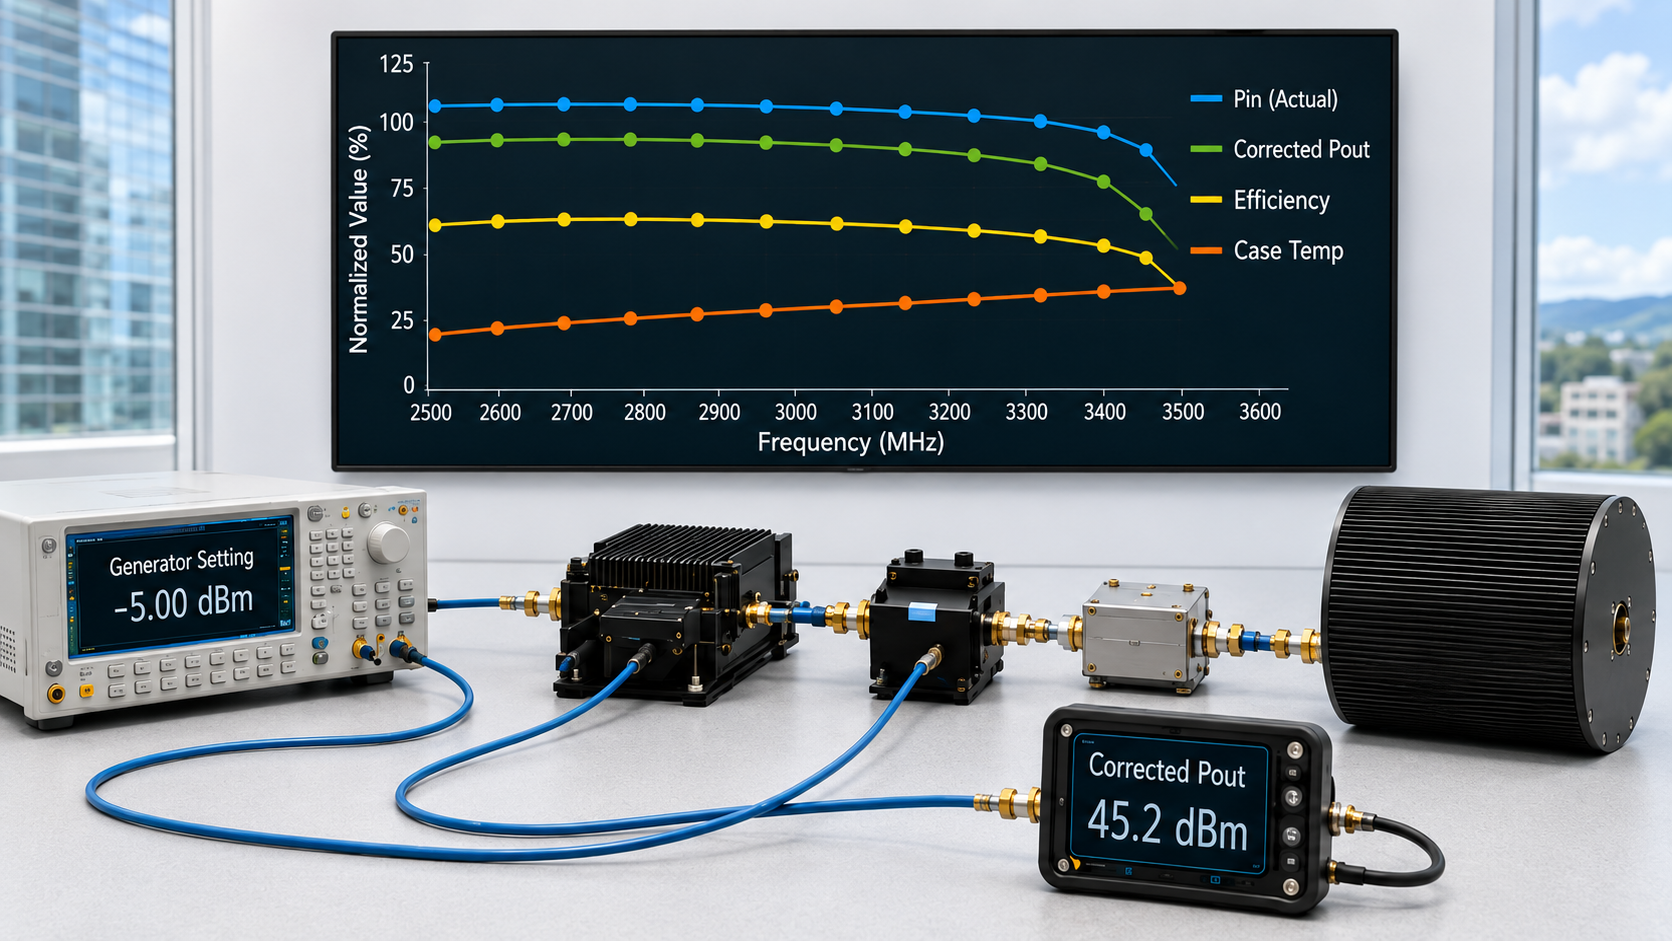
RF PA band edge output can fall for several different reasons. The amplifier may show real gain, matching, compression, or efficiency roll-off near its lower or upper frequency edge. However, the same symptom can also be created by input-drive variation, incomplete measurement correction, antenna mismatch, PA-terminal voltage loss, thermal drift, or protection foldback.
Replacing the RF PA will not solve a driver, test-path, supply, cooling, or installed-load problem. Before assigning the drop to the amplifier, engineers should identify which measurement or operating boundary actually failed.
For Wideband RF Power Amplifier Modules, the useful question is not simply whether edge output is lower than center-frequency output. The useful question is which variable changed at the affected frequency and whether the verified result still meets the project limit.
1. Why a Band-Edge Drop Is Not Always a PA Defect
Wideband RF power amplifiers do not always deliver identical gain, output, efficiency, and current across their complete operating range.
Near a lower or upper edge, the PA may have less design margin because of:
- Broadband input and output matching limits
- Frequency-dependent transistor gain
- Higher RF drive requirements
- Earlier compression
- Lower efficiency
- Reduced mismatch tolerance
- Thermal or protection thresholds reached sooner
These mechanisms can produce real PA-side band-edge roll-off.

A lower reading at one edge does not automatically prove that the PA is defective. The apparent drop may instead come from:
- Lower actual Pin at the PA input
- Signal-source or driver roll-off
- Incorrect coupler or attenuator correction
- Frequency-dependent cable loss
- Antenna or installed-path mismatch
- PA-terminal voltage reduction
- Thermal stabilization
- Protection foldback
The first diagnostic task is to determine whether the drop remains at the PA output reference plane under controlled input, load, supply, and thermal conditions.
Keep the Measurement Boundaries Separate
A band-edge result may be reported at:
- The PA output connector
- The cabinet or feeder output
- The antenna input
These boundaries are related, but they are not interchangeable.
A PA may pass at its own output connector while the antenna-input result fails because of feeder, switch, filter, connector, or antenna-path effects.
A PA-port result may also appear low when the instrument reading has not been corrected properly to the PA output reference plane.
The failing boundary must therefore be identified before the PA itself is rejected.
Lower Output Is Not Automatically a Failure
A band-edge point may be lower than the center frequency and still meet the project requirement.
The correct comparison is not:
Edge output versus center-frequency output
The correct comparison is:
Verified edge output versus the required minimum at the same reference plane and operating condition
A repeatable PA-side drop proves that the amplifier has a real frequency-dependent response under the stated test condition. It should be called a defect only when it falls outside the agreed supplier specification or project acceptance limit.
This is why RF PA band-edge verification should use absolute output limits and project-critical frequency points rather than assuming that every point must equal the center-frequency result.
2. How Input Drive and Measurement Errors Create a False Drop
A false band-edge drop occurs when the reported output decreases even though the PA itself has not developed an equivalent additional loss.
The two most common causes are:
- Actual Pin changes with frequency
- The measurement path is corrected incorrectly
Generator Setting Is Not Actual PA Input
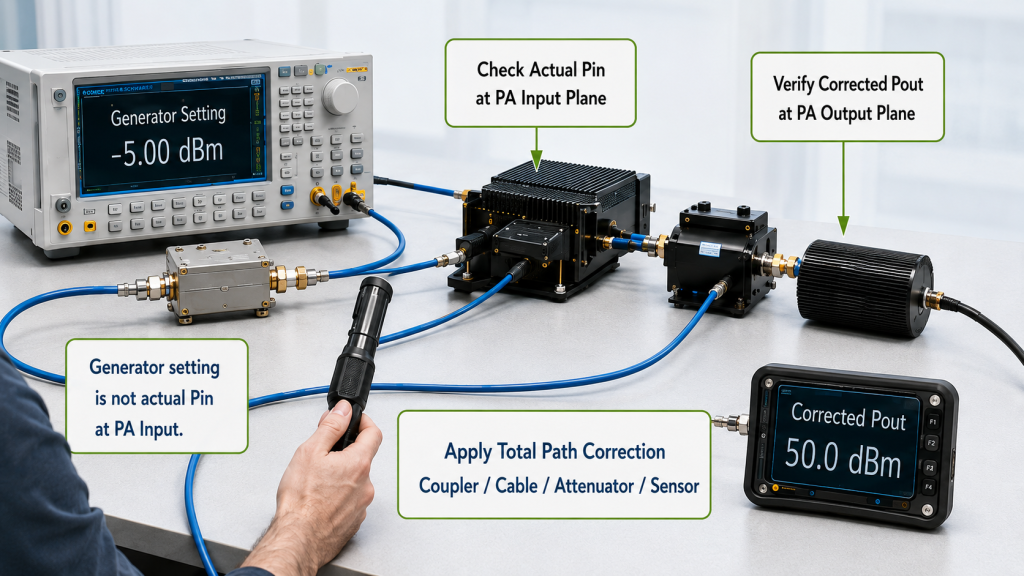
A signal generator may use the same displayed setting at every frequency, but that does not prove that the same power reaches the PA input connector.
Frequency-dependent loss or gain may exist in the input cables, driver stages, filters, switches, adapters, or attenuators.
The test record should distinguish between:
- Signal-generator setting
- Actual or corrected Pin at the PA input reference plane
When actual Pin and Pout fall by a similar amount while calculated gain remains stable, the first suspect should be the source, driver, or input path—not the PA output stage.
Fixed-Drive and Adjusted-Drive Tests Answer Different Questions
A fixed-drive sweep maintains the same actual Pin at every frequency. It reveals output and gain variation under one controlled input condition.
An adjusted-drive sweep changes Pin at each frequency. It may be used to determine:
- The input required to reach a target output
- Output at a defined compression or linearity boundary
- Maximum output before an agreed stopping condition is reached
The stopping condition may be a target output, maximum permitted Pin, defined compression or linearity limit, current or temperature limit, protection threshold, or saturation criterion.
Without that boundary, “maximum output” is not a repeatable test result.
If Pin is increased at a weak edge until the target Pout is reached, the point-by-point input level must remain visible in the report. Otherwise, the result can hide poor gain flatness or excessive driver demand.
Correct the Instrument Reading to the Reference Plane
A power sensor, power meter, or spectrum analyzer normally measures through a directional coupler, attenuator, cable, and other passive components.
The displayed reading is therefore not automatically the PA output.
Under a positive-correction convention:
Corrected PA Output = Instrument Reading + Total Path Correction
The Total Path Correction may include the directional-coupler factor, attenuator loss, measurement-cable loss, connector loss, splitter loss, and sensor correction.
This equation assumes that coupling factors and path losses are entered as positive correction values. When a calibration file uses signed gain or loss values, the documented sign convention must be followed rather than adding every number automatically.
The correction should be frequency-specific where the test path changes across the measured range.
Separate Four Output Conditions
A report should not combine several different test dimensions into one undefined term such as “maximum output.”
The following four conditions should be stated separately:
- Operating point: linear, P1dB, defined compression, saturated, or backed-off
- Waveform: CW, pulsed, modulated, multicarrier, or noise-like
- Duty condition: continuous duty, defined pulse duty cycle, or burst duration
- Reported power: peak, average, or integrated channel power
For pulsed or modulated signals, the report should also record the waveform bandwidth, measurement bandwidth, detector or averaging method, and applicable duty condition.
A saturated CW result, pulsed peak result, and backed-off modulated average result cannot be compared as though they represent the same output boundary.
Define the Uncertainty Decision Rule Before Testing
A measured result close to the acceptance threshold may not provide clear positive margin once measurement uncertainty is considered.
A result slightly above the minimum limit should not automatically be described as a secure pass when its uncertainty interval crosses that limit.
The RFQ or test plan should define the decision rule before measurements begin. It may use an agreed guard band, uncertainty margin, or another documented acceptance method.
The rule should not be selected after the result is known.
3. What PA-Side Mechanisms Cause Real Edge Roll-Off
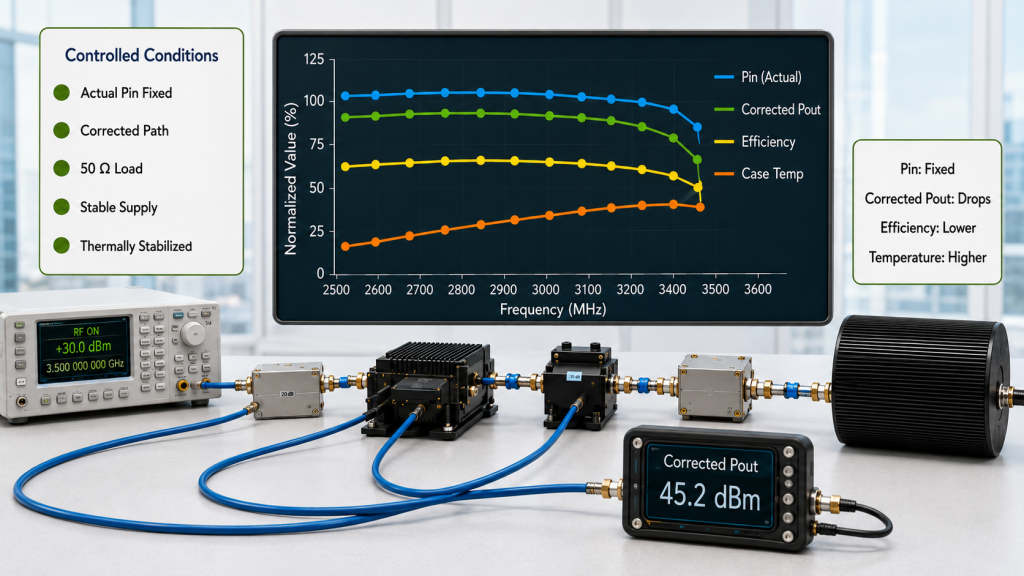
After actual Pin and frequency-specific measurement corrections have been verified, a repeatable drop at the PA connector may be classified as true PA-side band-edge behavior.
Gain and Matching Change Across Frequency
Broadband matching networks balance performance across a wide span. They do not always provide identical gain or impedance transformation at every point.
Near an edge, the PA may show:
- Lower gain
- Greater input-drive requirement
- Earlier compression
- Lower available output
- Reduced efficiency
- Higher sensitivity to load variation
A useful diagnosis records actual Pin and corrected Pout at defined reference planes.
With actual Pin fixed and the measurement corrections verified, a repeatable reduction in corrected Pout is evidence of real PA-side frequency response.
Compression May Begin Earlier
A PA may reach the required center-frequency output with moderate drive but approach compression earlier near an edge.
The result should define the operating point separately from the waveform, duty condition, and reported power metric.
For example, a test condition may be stated as:
P1dB operating point, CW waveform, continuous duty, average power
or:
Backed-off operating point, modulated waveform, continuous duty, integrated channel power
These descriptions are more repeatable than broad labels such as “full power” or “maximum output.”
A high saturated CW output does not prove that the PA can deliver the same average power with a high-PAPR waveform while meeting EVM or adjacent-channel requirements.
Lower Efficiency Reduces Thermal Margin
Lower efficiency means that more DC input power becomes heat instead of RF output.
At an affected edge, this may produce:
- Higher current for the same output
- Faster temperature rise
- Lower stabilized output
- Earlier thermal protection
- Less continuous-duty margin
A short cold-state sweep may pass even though the same point falls after thermal stabilization.
The Required Drive May Exceed System Capability
An adjusted-drive laboratory test may prove that the PA can reach the target output before the agreed stopping limit.
However, the installed SDR or driver may not provide the required edge-frequency Pin with sufficient margin.
The diagnosis should distinguish between:
- The PA cannot reach the required output within the agreed input and operating limits
- The PA can reach the output, but the installed driver cannot supply the required Pin
The second result is a driver-chain compatibility problem, not automatically a PA output-capability defect.
4. How Load, Voltage, and Heat Make the Drop Worse
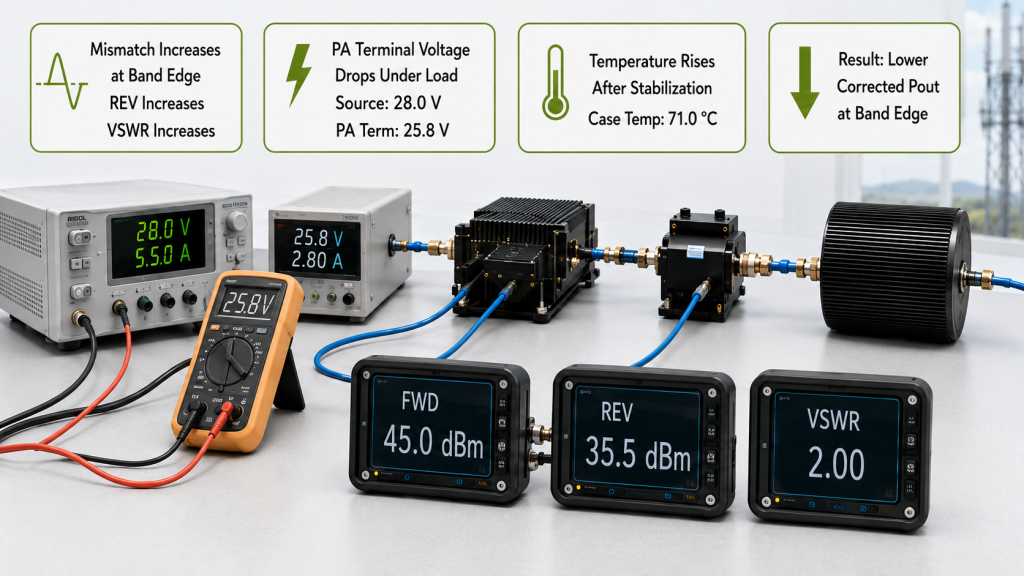
A PA may pass on a controlled 50 Ω load and deliver less output after installation because the installed operating conditions differ from the laboratory baseline.
Installed-Path Loss
Frequency-dependent loss in feeders, connectors, switches, filters, splitters, and protection devices can make cabinet-output or antenna-input power lower than PA-port output.
If the PA-port result passes but the antenna-input result fails, the installed path should be measured or calculated before the PA is rejected.
Antenna Mismatch and Reflected Power
A controlled 50 Ω load establishes the PA baseline. The installed antenna path may present a higher reflected-power condition at one edge.
This can affect:
- Forward power
- Net power delivered to the load
- DC current
- Temperature
- Protection state
- Output repeatability
When antenna mismatch changes usable RF output, the report must state whether the quoted result is:
- Forward power
- Reflected power
- Net power delivered to the load
Forward power alone should not be treated as accepted antenna power when reflected power is significant.
Forward power (FWD) and reflected power (REV) must be corrected to the same reference plane using the applicable forward and reverse coupling factors and path corrections.
Directional-coupler directivity and the reverse-channel measurement limit should also be considered, especially when REV is close to the measurement-system noise floor.
When net delivered power is calculated:
Net Delivered Power in Watts = FWD in Watts − REV in Watts
FWD and REV values in dBm must not be subtracted directly. Both values should first be converted to linear watts, subtracted, and then converted back to dBm where required.
The mismatch effect should not be deducted a second time when it is already included in the measured operating-state output or protection response.
PA-Terminal Voltage
The DC source setting may differ from the voltage available at the PA terminals under RF load.
Cable resistance, relays, fuses, connectors, distribution boards, and high current can reduce module-side voltage.
For a 28 V PA architecture, record the source voltage, PA-terminal voltage, and current at the affected frequency under the required RF operating condition.
If the edge point requires more current, its sensitivity to distribution loss may be greater than at the center frequency.
Thermal Stabilization
A point that passes immediately after startup may fall after thermal equilibrium.
Cold and stabilized results should be compared with actual Pin, PA-terminal voltage, load, cooling, duty, and measurement correction held consistently.
A hot-state reduction may indicate reduced efficiency, cooling margin, bias drift, voltage loss, or thermal protection rather than intrinsic frequency response alone.
5. How to Isolate the Root Cause Before Replacing the PA
A controlled diagnosis should follow a fixed sequence.
Step 1: Confirm Actual Pin
Measure or correct Pin at the PA input reference plane.
Do not rely only on the signal-generator setting.
Step 2: Verify the Output Correction
Apply the approved frequency-specific correction record and documented sign convention.
Confirm that the corrected result refers to the intended PA, cabinet, feeder, or antenna reference plane.
Step 3: Repeat on a Controlled Load
Test the same point on a controlled 50 Ω dummy load.
If it passes on the dummy load but fails on the installed path, investigate path loss, mismatch, or protection behavior.
Step 4: Compare Cold and Stabilized Results
Repeat the point after the defined thermal stabilization period without changing actual Pin, PA-terminal voltage, load, cooling, waveform, or duty condition.
Step 5: Record DC and Protection Feedback
At the weak point, record:
- PA-terminal voltage
- Current
- Forward power (FWD)
- Reflected power (REV)
- VSWR where applicable
- Temperature
- Alarm or foldback status
- Recovery behavior
Step 6: Classify the Failed Boundary
Only then should the result be classified as one of the following:
- Source or input-path variation
- Measurement-correction problem
- Intrinsic PA gain, matching, compression, or efficiency behavior
- PA protection or control response
- Driver-margin limitation
- Installed-path loss
- Antenna mismatch
- DC distribution limitation
- Thermal limitation
Separating intrinsic PA response from protection response is important. A true PA frequency-response limit may require another band split or amplifier design, while a protection response may be triggered by an external load, temperature, voltage, or threshold condition.
Band-Edge Output Drop: Symptom-to-Cause Diagnosis
| Observed Result | Likely Cause | First Check |
|---|---|---|
| Pout and actual Pin fall by a similar amount while gain stays stable | Source, driver, or input-path variation | Confirm actual Pin at the PA input |
| Pout changes after revised correction data is applied | Frequency-dependent measurement-path correction | Verify Total Path Correction and sign convention |
| With actual Pin fixed and corrections verified, corrected Pout falls and added drive cannot recover the target before the stopping limit | Intrinsic PA compression, matching, efficiency, or output-capability limit | Repeat at the defined operating point and record Pin, Pout, Idc, and temperature |
| Target Pout is reached only with higher Pin | Edge-frequency gain or driver-margin issue | Record required Pin and the adjusted-drive stopping condition |
| REV rises while Pout falls | Load mismatch or FWD/REV measurement problem | Repeat on a controlled load and verify forward/reverse coupler calibration |
| PA-port output passes but antenna-input power fails | Installed-path loss or antenna mismatch | Measure path loss and define forward versus net delivered power |
| Pout falls as PA-terminal voltage falls | DC distribution loss | Measure voltage at the PA under RF load |
| Pout falls only after stabilization | Thermal, bias, cooling, or voltage margin | Compare controlled cold- and hot-state data |
| Protection activates at one edge | Load-sensitive or protection-threshold behavior | Record FWD, REV, voltage, temperature, alarm, and recovery |
A repeatable PA-side drop is not automatically a defect. It becomes a rejection issue only when it misses the agreed supplier specification or project acceptance limit under the defined test condition.
When a required point cannot meet that limit, the next action may involve:
- Increasing driver margin
- Improving DC distribution
- Improving cooling
- Reducing installed-path loss
- Correcting the antenna or load condition
- Selecting a band split or PA design that places the required frequency farther from the module edge
- Selecting a different PA architecture
Conclusion
An RF PA band-edge output drop should be assigned to the amplifier only after actual Pin, frequency-specific measurement correction, controlled-load behavior, PA-terminal voltage, thermal state, and protection feedback have been verified.
A repeatable PA-side drop proves a real frequency-dependent response. It should be treated as a defect or rejection issue only when it falls outside the agreed specification or project limit.
A swept-frequency full-power test can provide the controlled Pin, Pout, voltage, current, temperature, load, and protection data needed for this diagnosis.
RF SKYPOWER can support an early engineering review before the PA is rejected or the RF architecture is changed.
For the review, provide:
- Affected frequency and required limit
- Actual Pin, corrected Pout, and reference planes
- Frequency-specific path corrections
- Fixed- or adjusted-drive method and stopping condition
- Operating point, waveform, duty, and reported power metric
- PA-terminal voltage and current
- Load, FWD/REV, and cold- or hot-state conditions
- Protection status and test-report identity
These inputs help separate intrinsic PA roll-off from source, measurement, driver, load, supply, thermal, and protection effects.
Submit the band-edge output data to the RF SKYPOWER engineering team.